• Headquarters

    Zurich, Switzerland

  • Industry

    IT for Manufacturing

  • Website

  • Timelines

    3 months

FOOD PRODUCTION
(THE DIGITAL WAY)

Smartening up factories
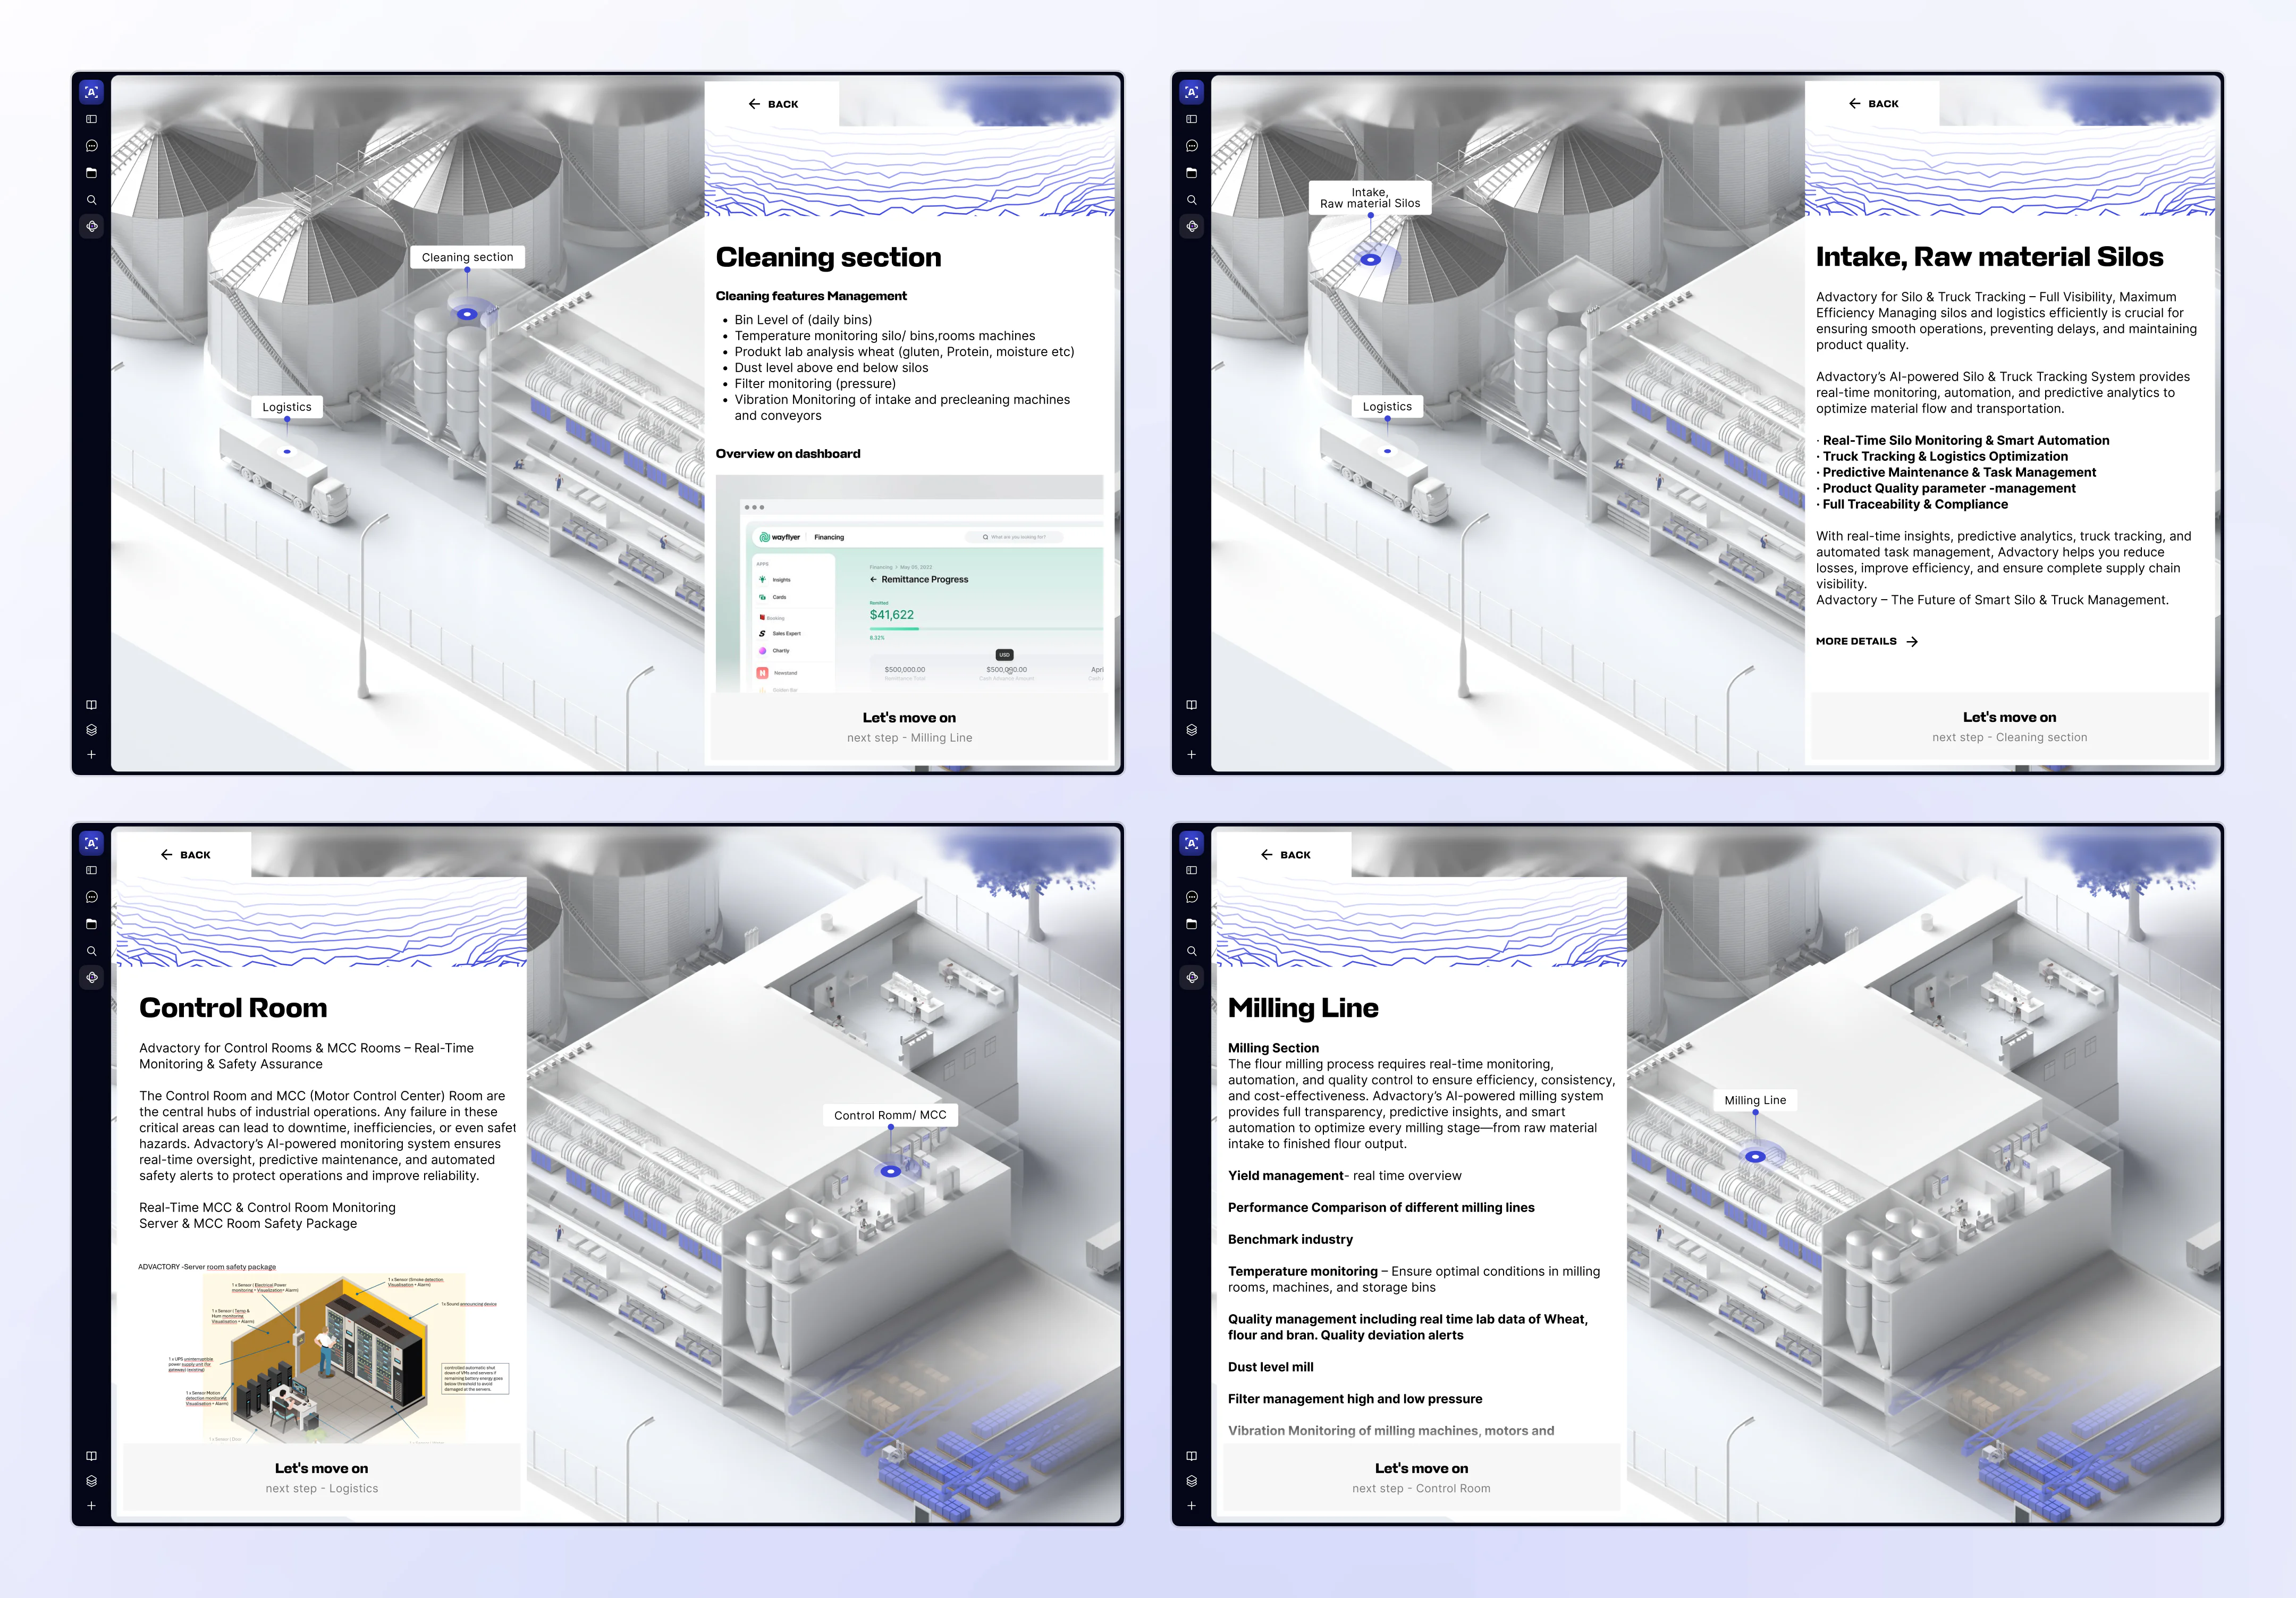
Advactory was built for the moments when production starts to feel too complex to manage by gut feeling and spreadsheets. It’s a SaaS platform that pulls together data from tasks, sensors, and AI to optimize how factories work. That’s how Advactory helps food producers stay compliant, maintain quality, and run safer, more efficient operations.
Four Advactory interface screens showing 3D facility views and information panels for silo intake, cleaning, milling, and control room operations.

BRANDING & EARLY FOUNDATIONS

The project kicked off with a full rebrand with the logo, identity, decks, and conference visuals. Only after shaping how Advactory looks and speaks did we move on to designing a site that could clearly explain the product.
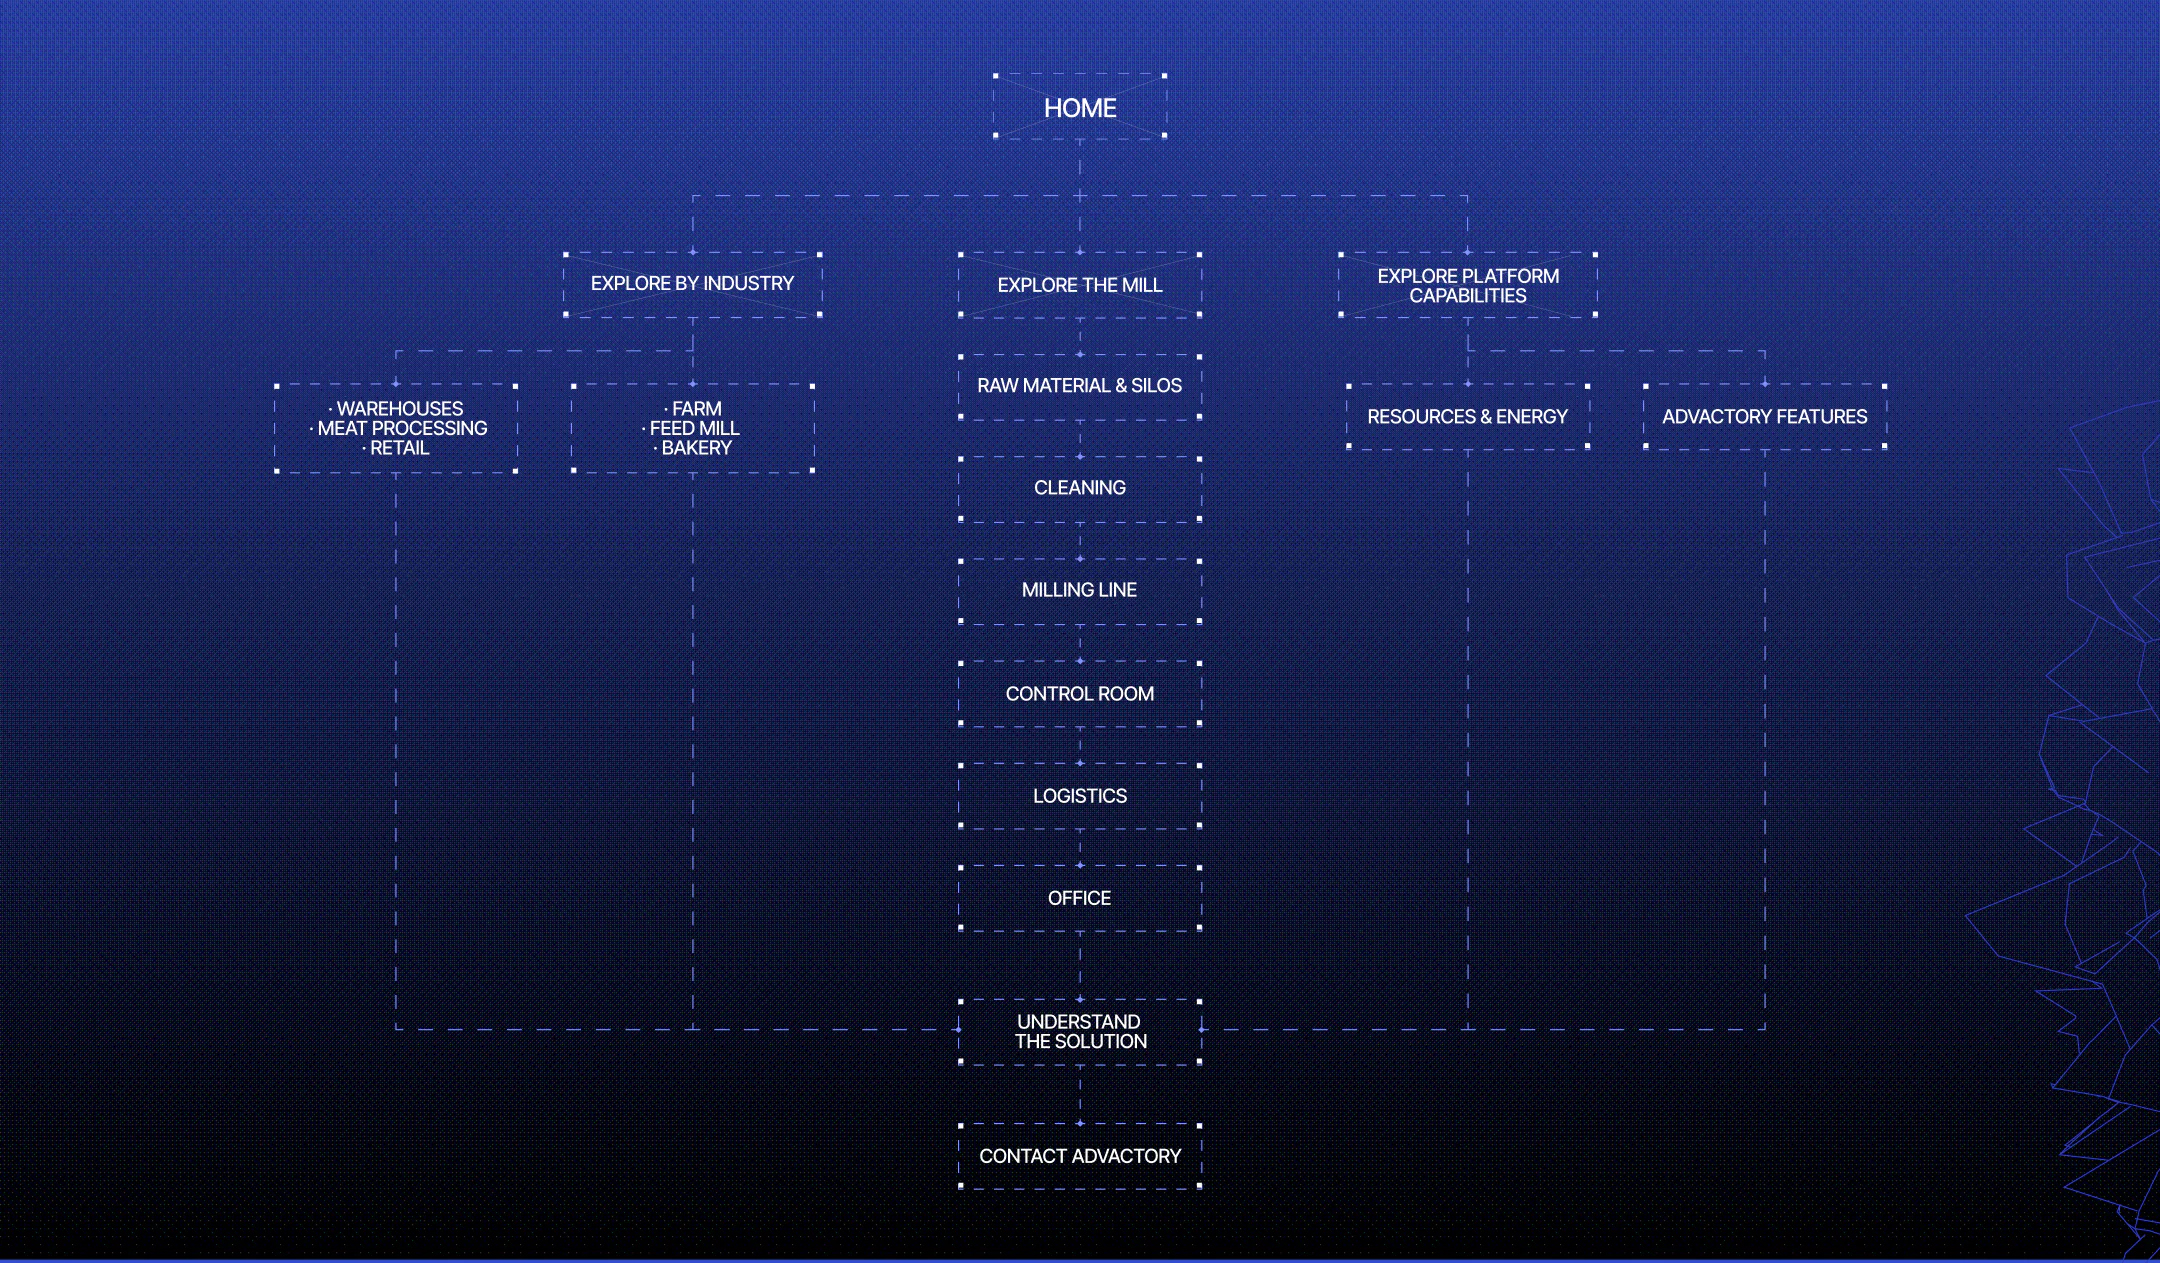
Advactory website user flow showing paths through industries, mill processes, and platform capabilities to solution details and contact.

FROM CHAOS TO A SYSTEM

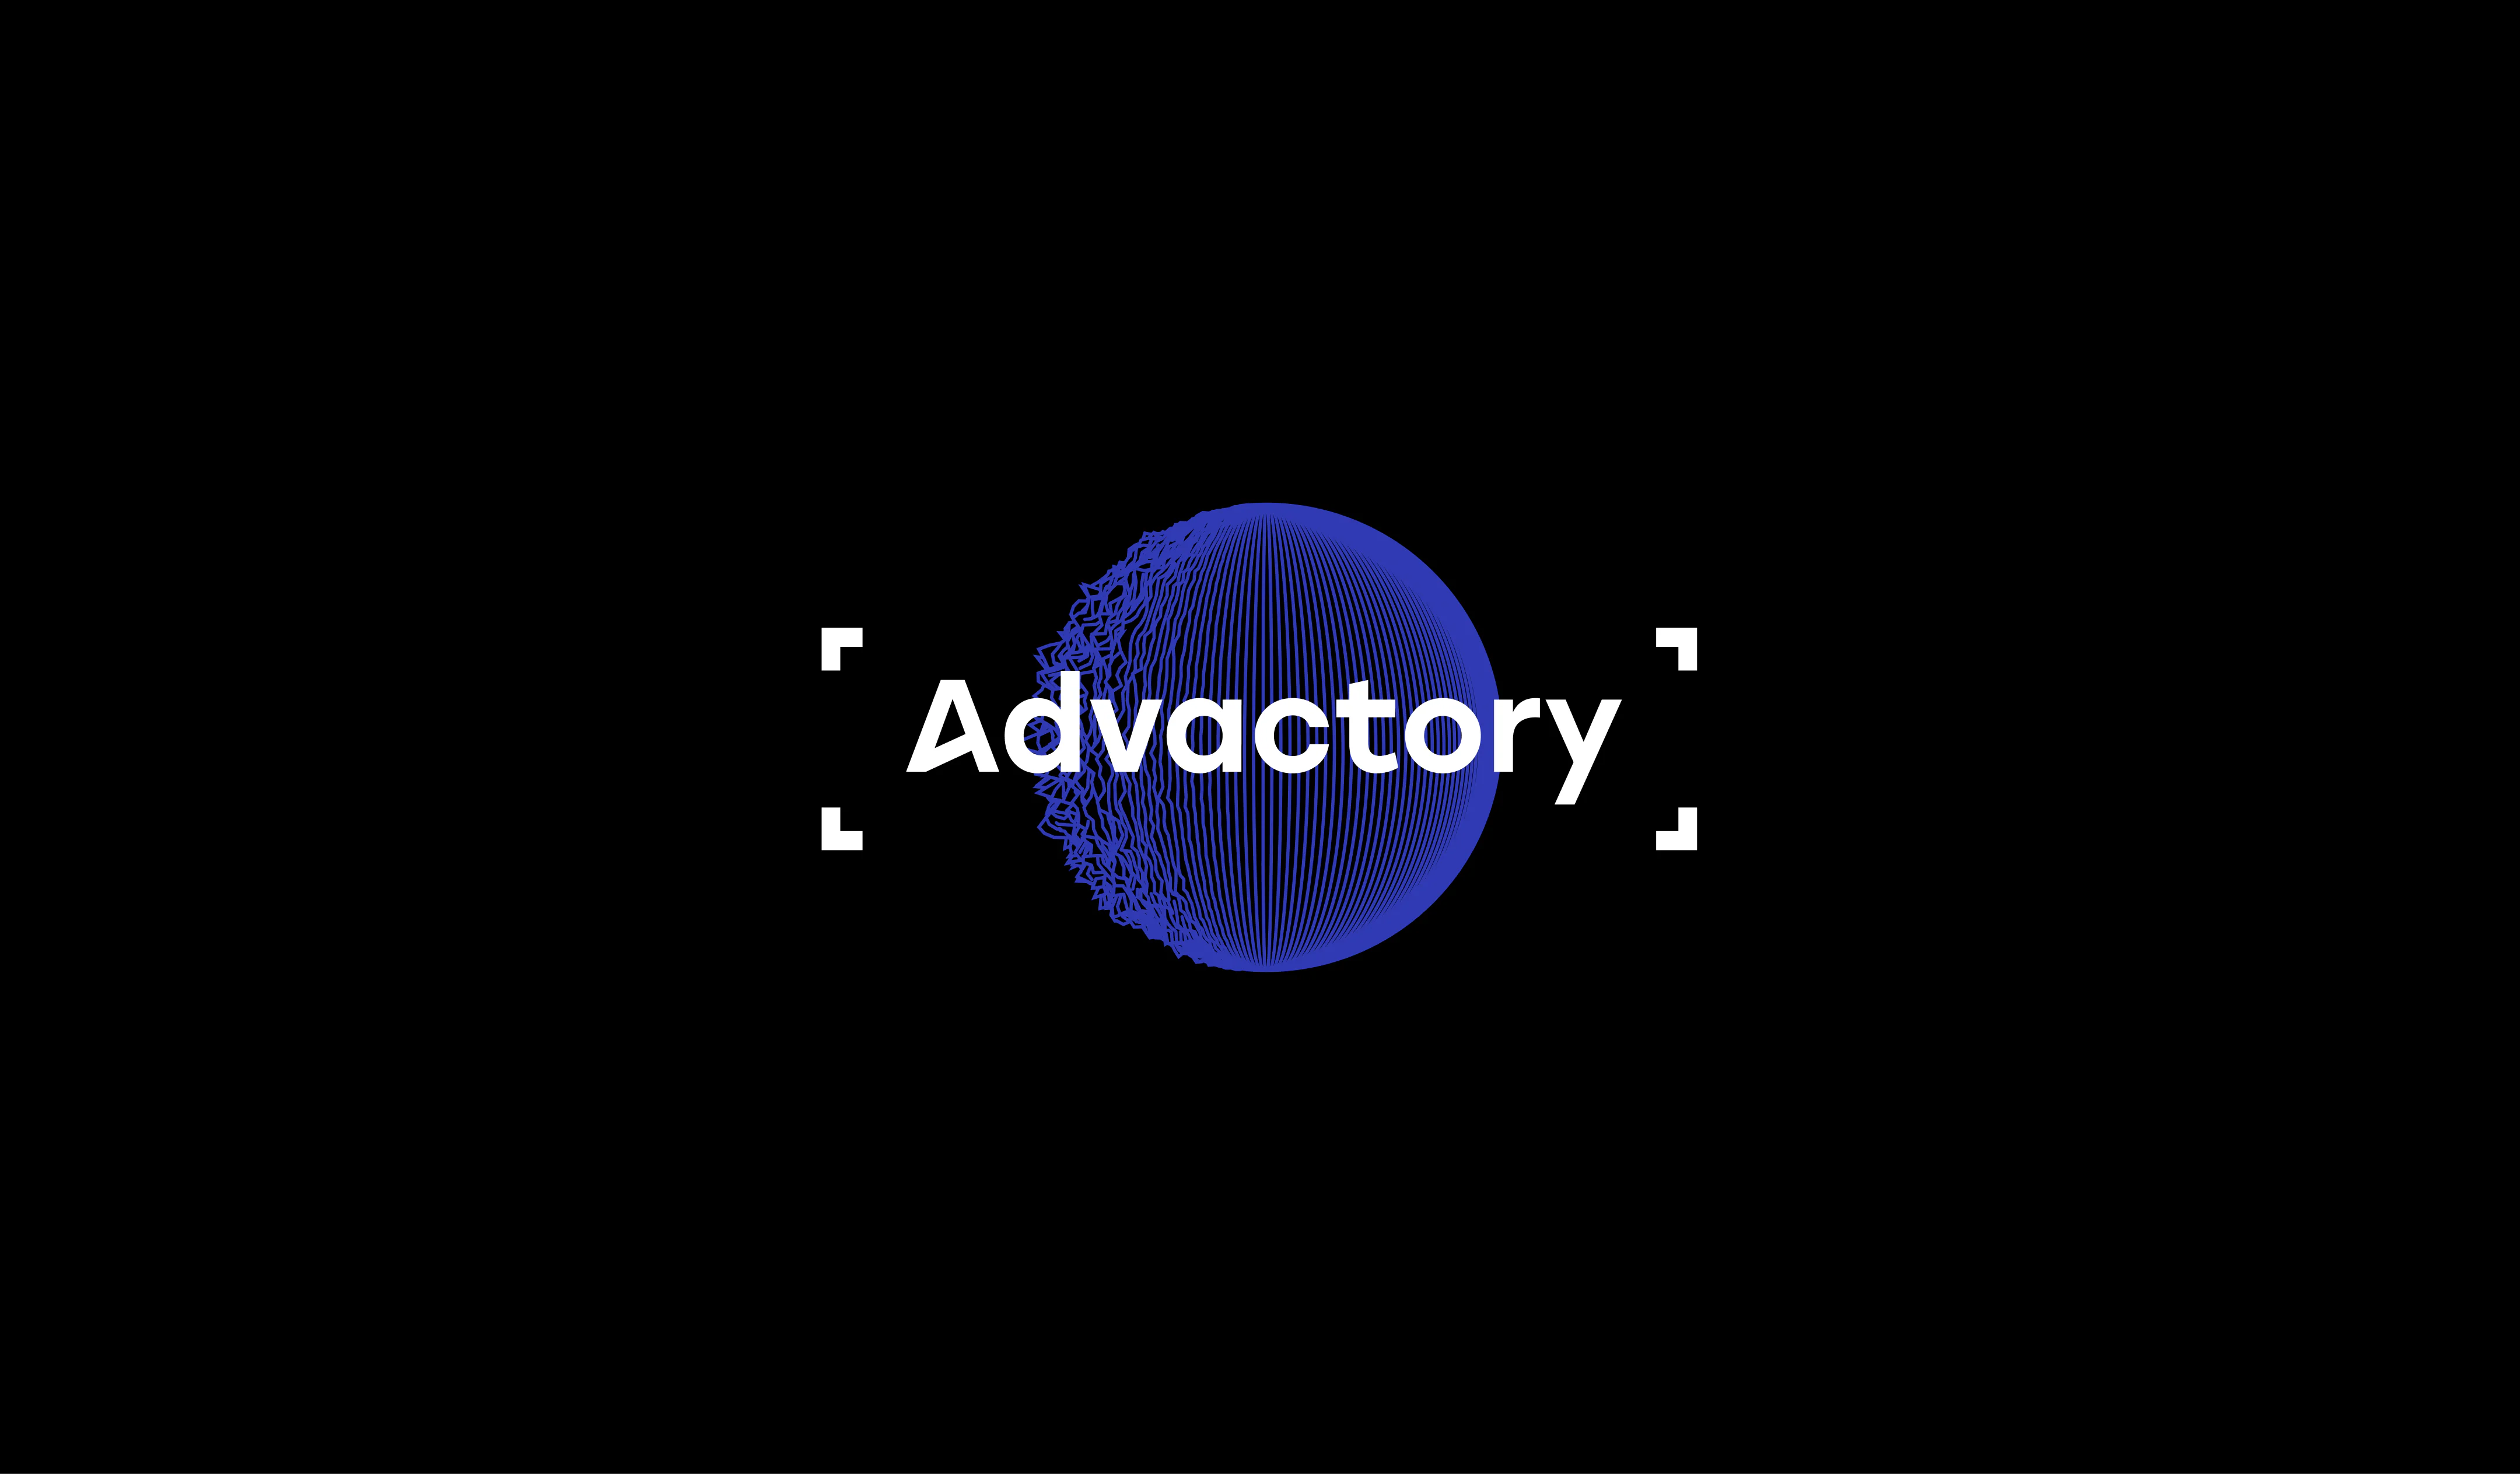
The sphere became the core visual metaphor of the entire project, and not by accident. It represents Advactory as a whole ecosystem rather than a set of disconnected features. On the left, it’s messy, fragmented, slightly out of control, just like real production environments filled with scattered data and manual processes. As the sphere rotates to the right, those lines straighten and align, turning into a precise, structured surface. Visually, it captures how the product transforms operational chaos into order and control.
White Advactory wordmark over a blue wireframe sphere, framed by corner brackets on a black background.

WHAT IF THE WEBSITE WAS A MAP?

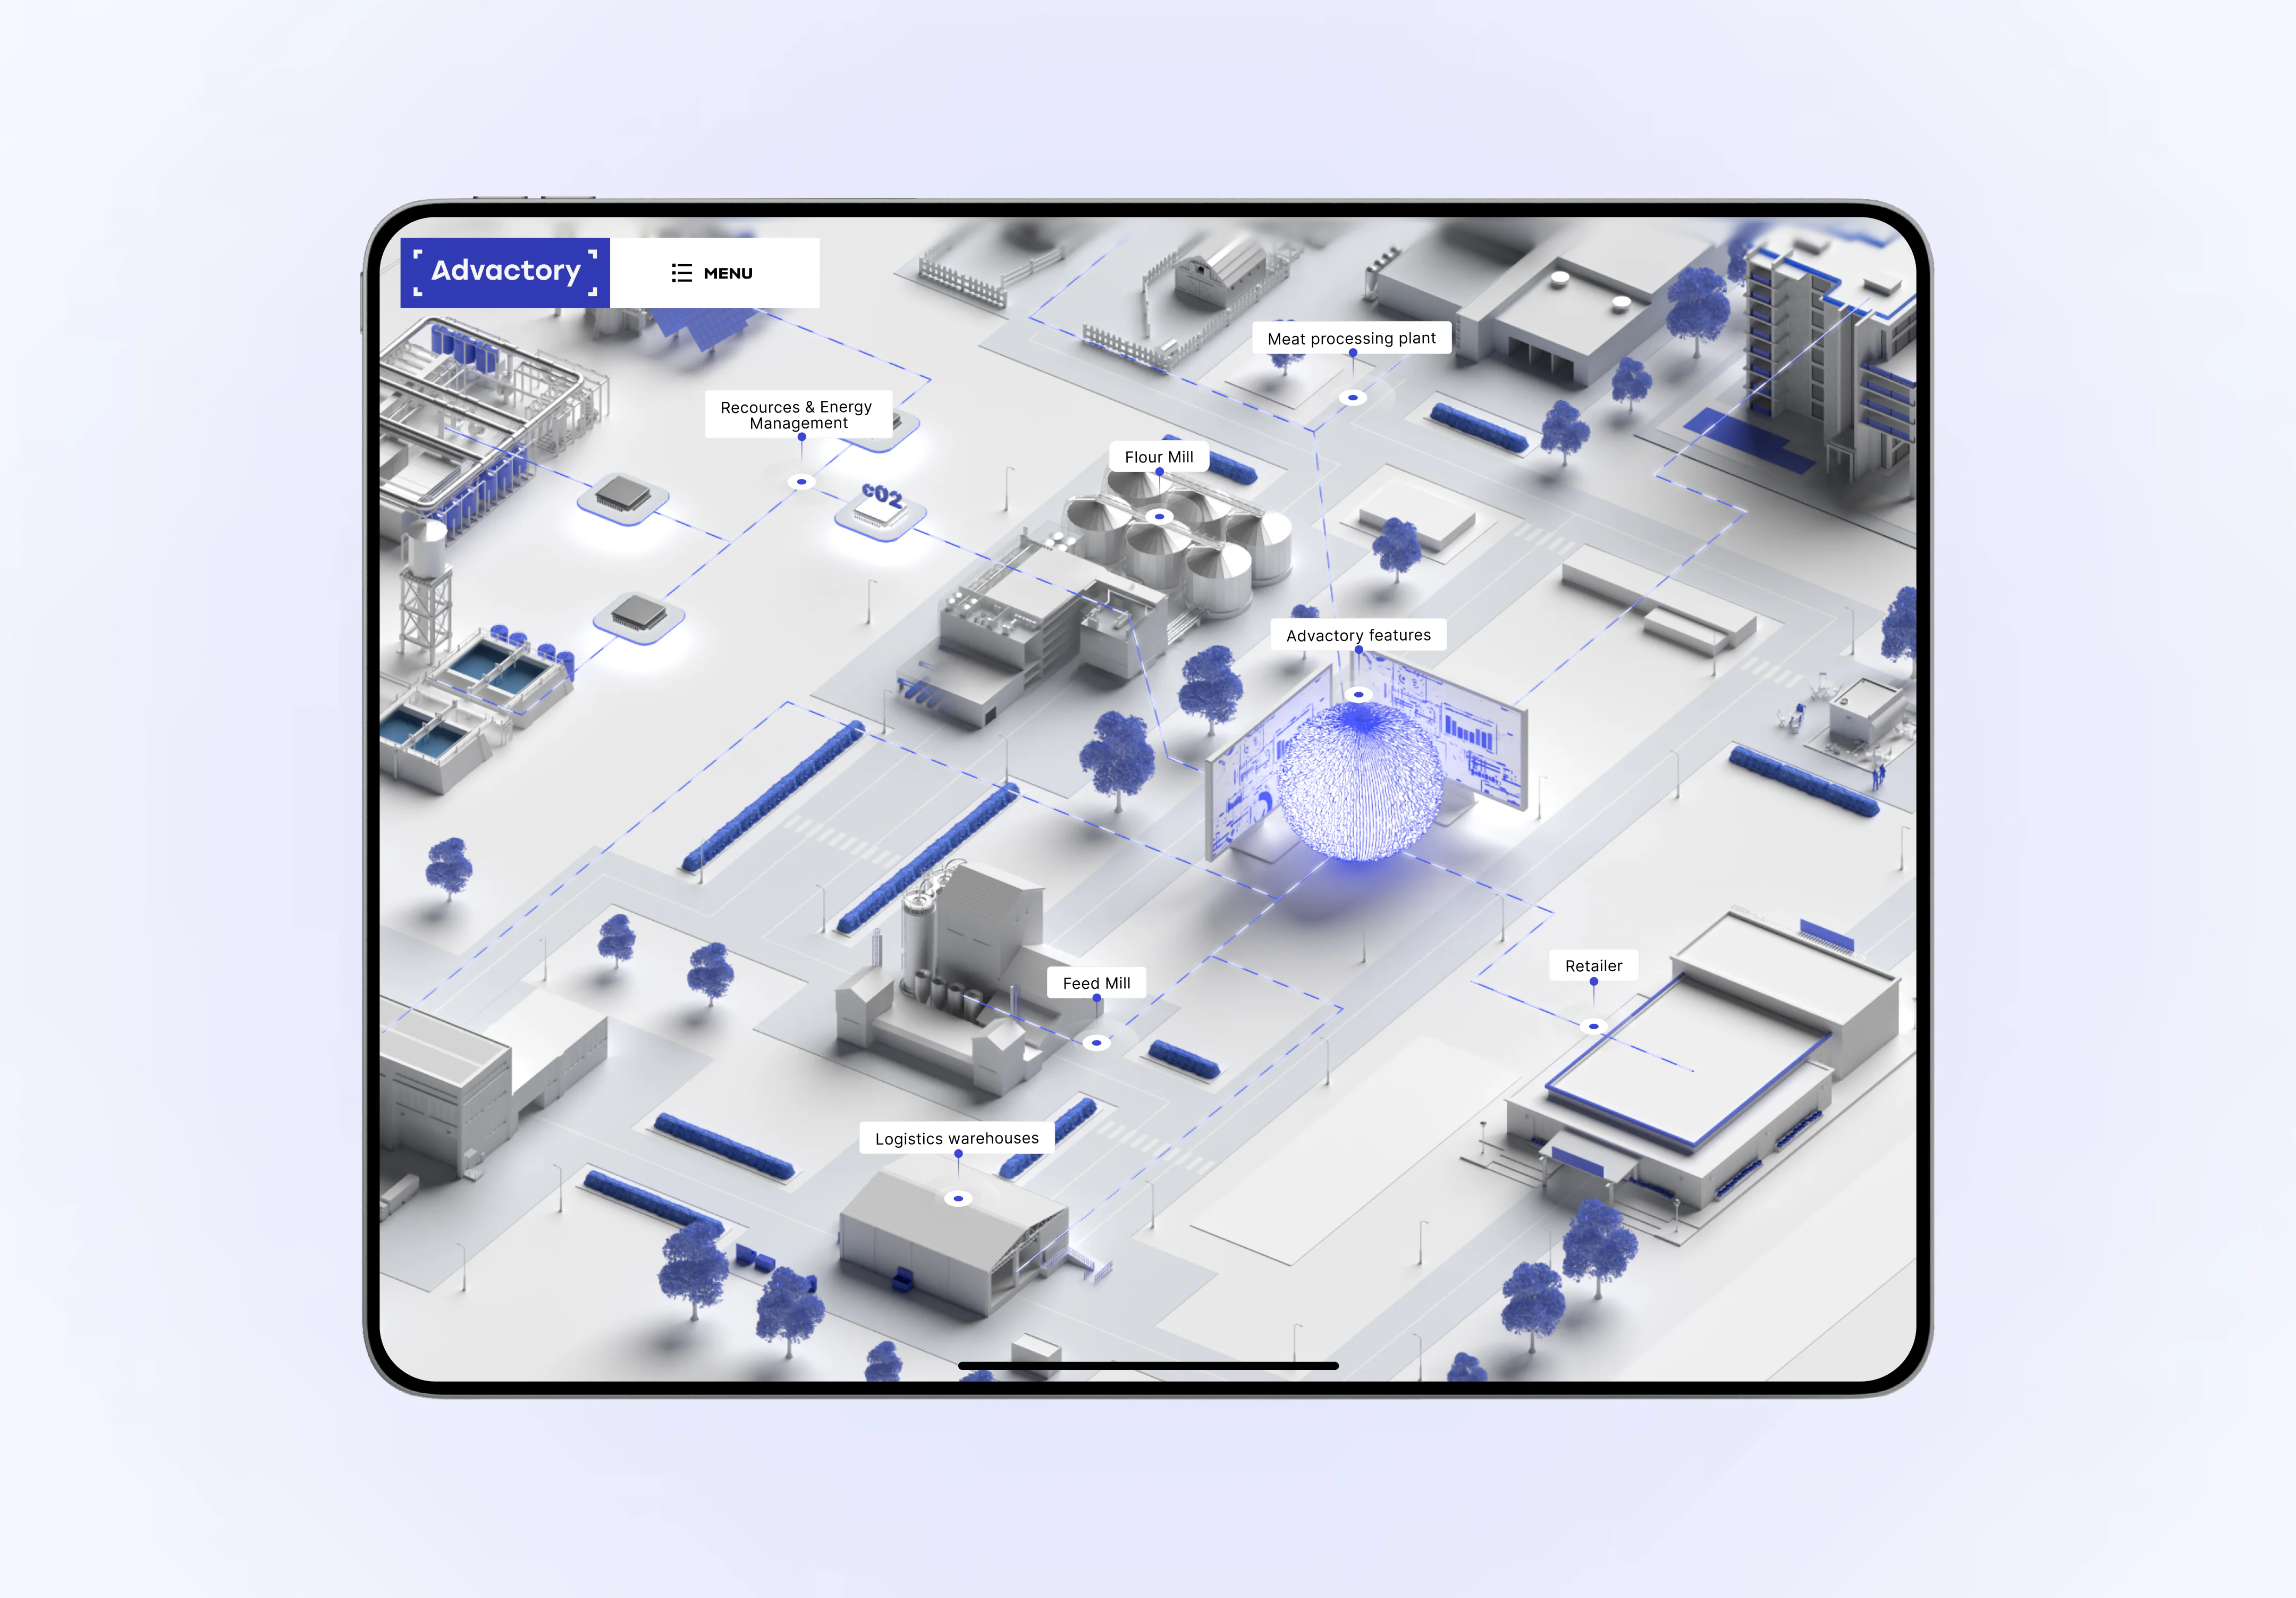
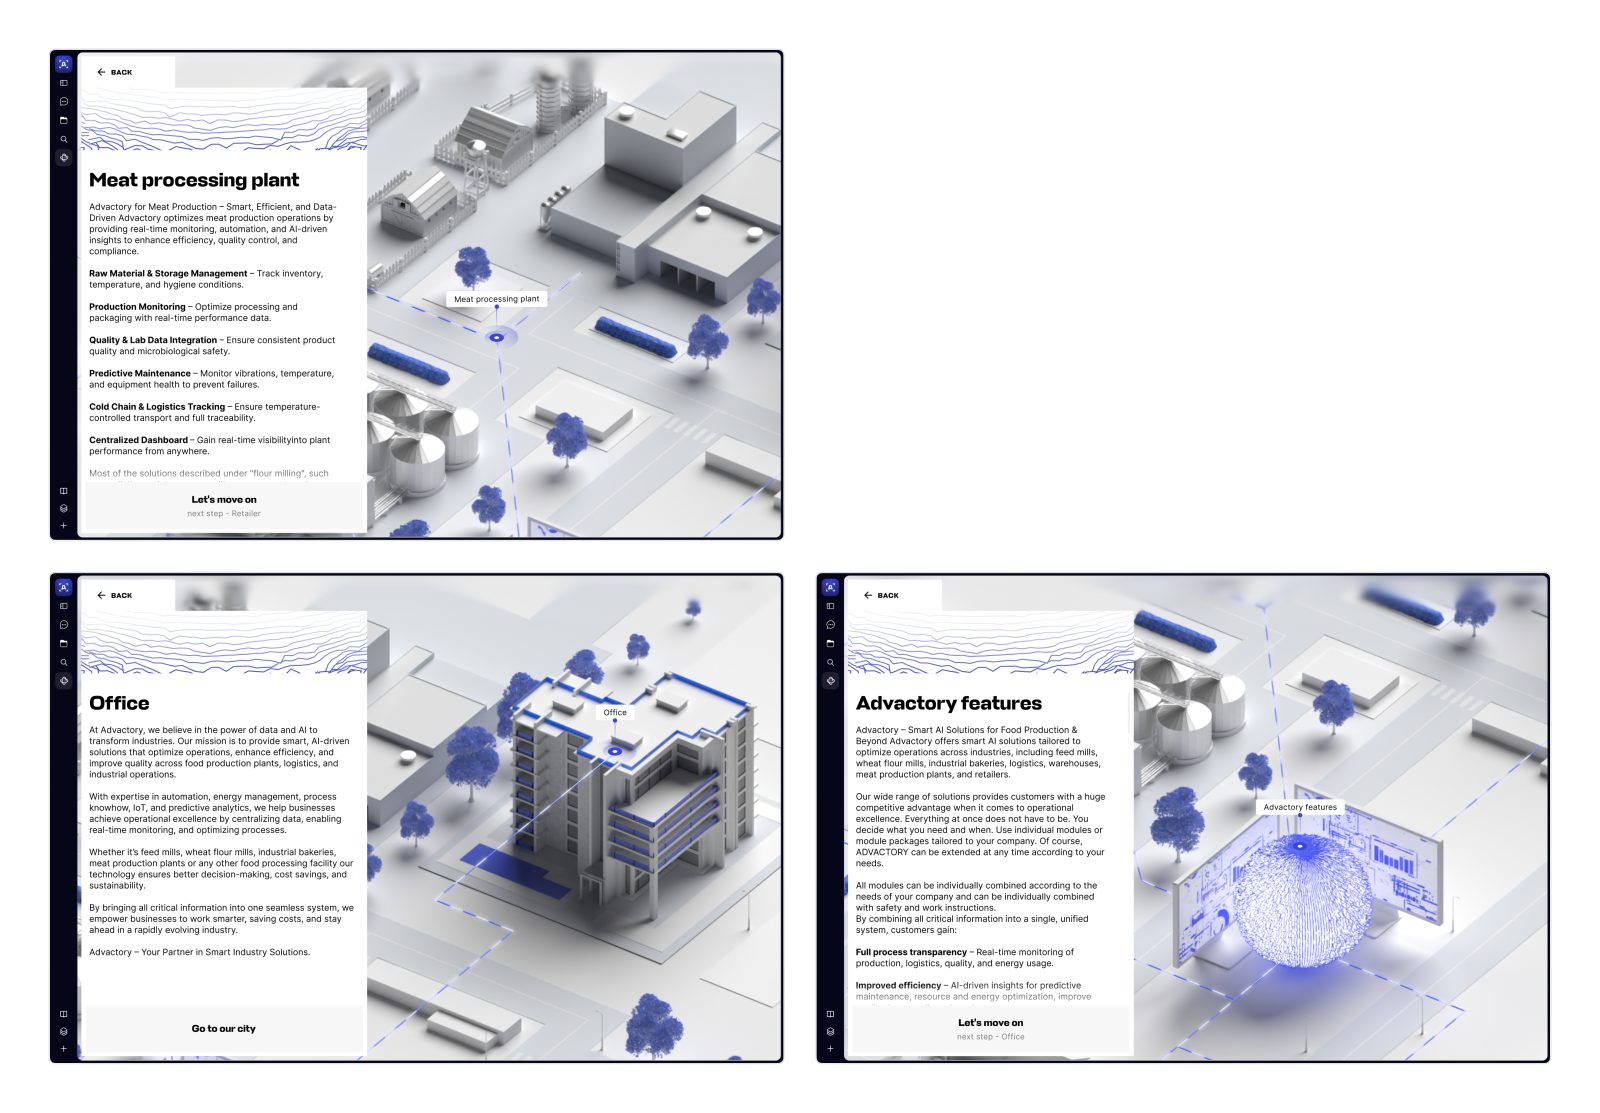
Given the nature of the Advactory product, we leaned into an idea that sounded slightly crazy at first: what if the website worked like an interactive map? Instead of pages and sections, we designed a visual production chain, unfolding on a single canvas. At the center sits Advactory itself, represented as a sphere based on the logo, with all the tracked objects orbiting around it. One of the key nodes is the Mill — the heart of food production. Click into it, and the site zooms into a second map that reveals the internal manufacturing flow: from raw materials entering silos to processing stages and, finally, the logistics of shipping finished products.
website on a tablet, featuring a 3D industrial map with labeled mills, logistics warehouses, retail, and energy management.
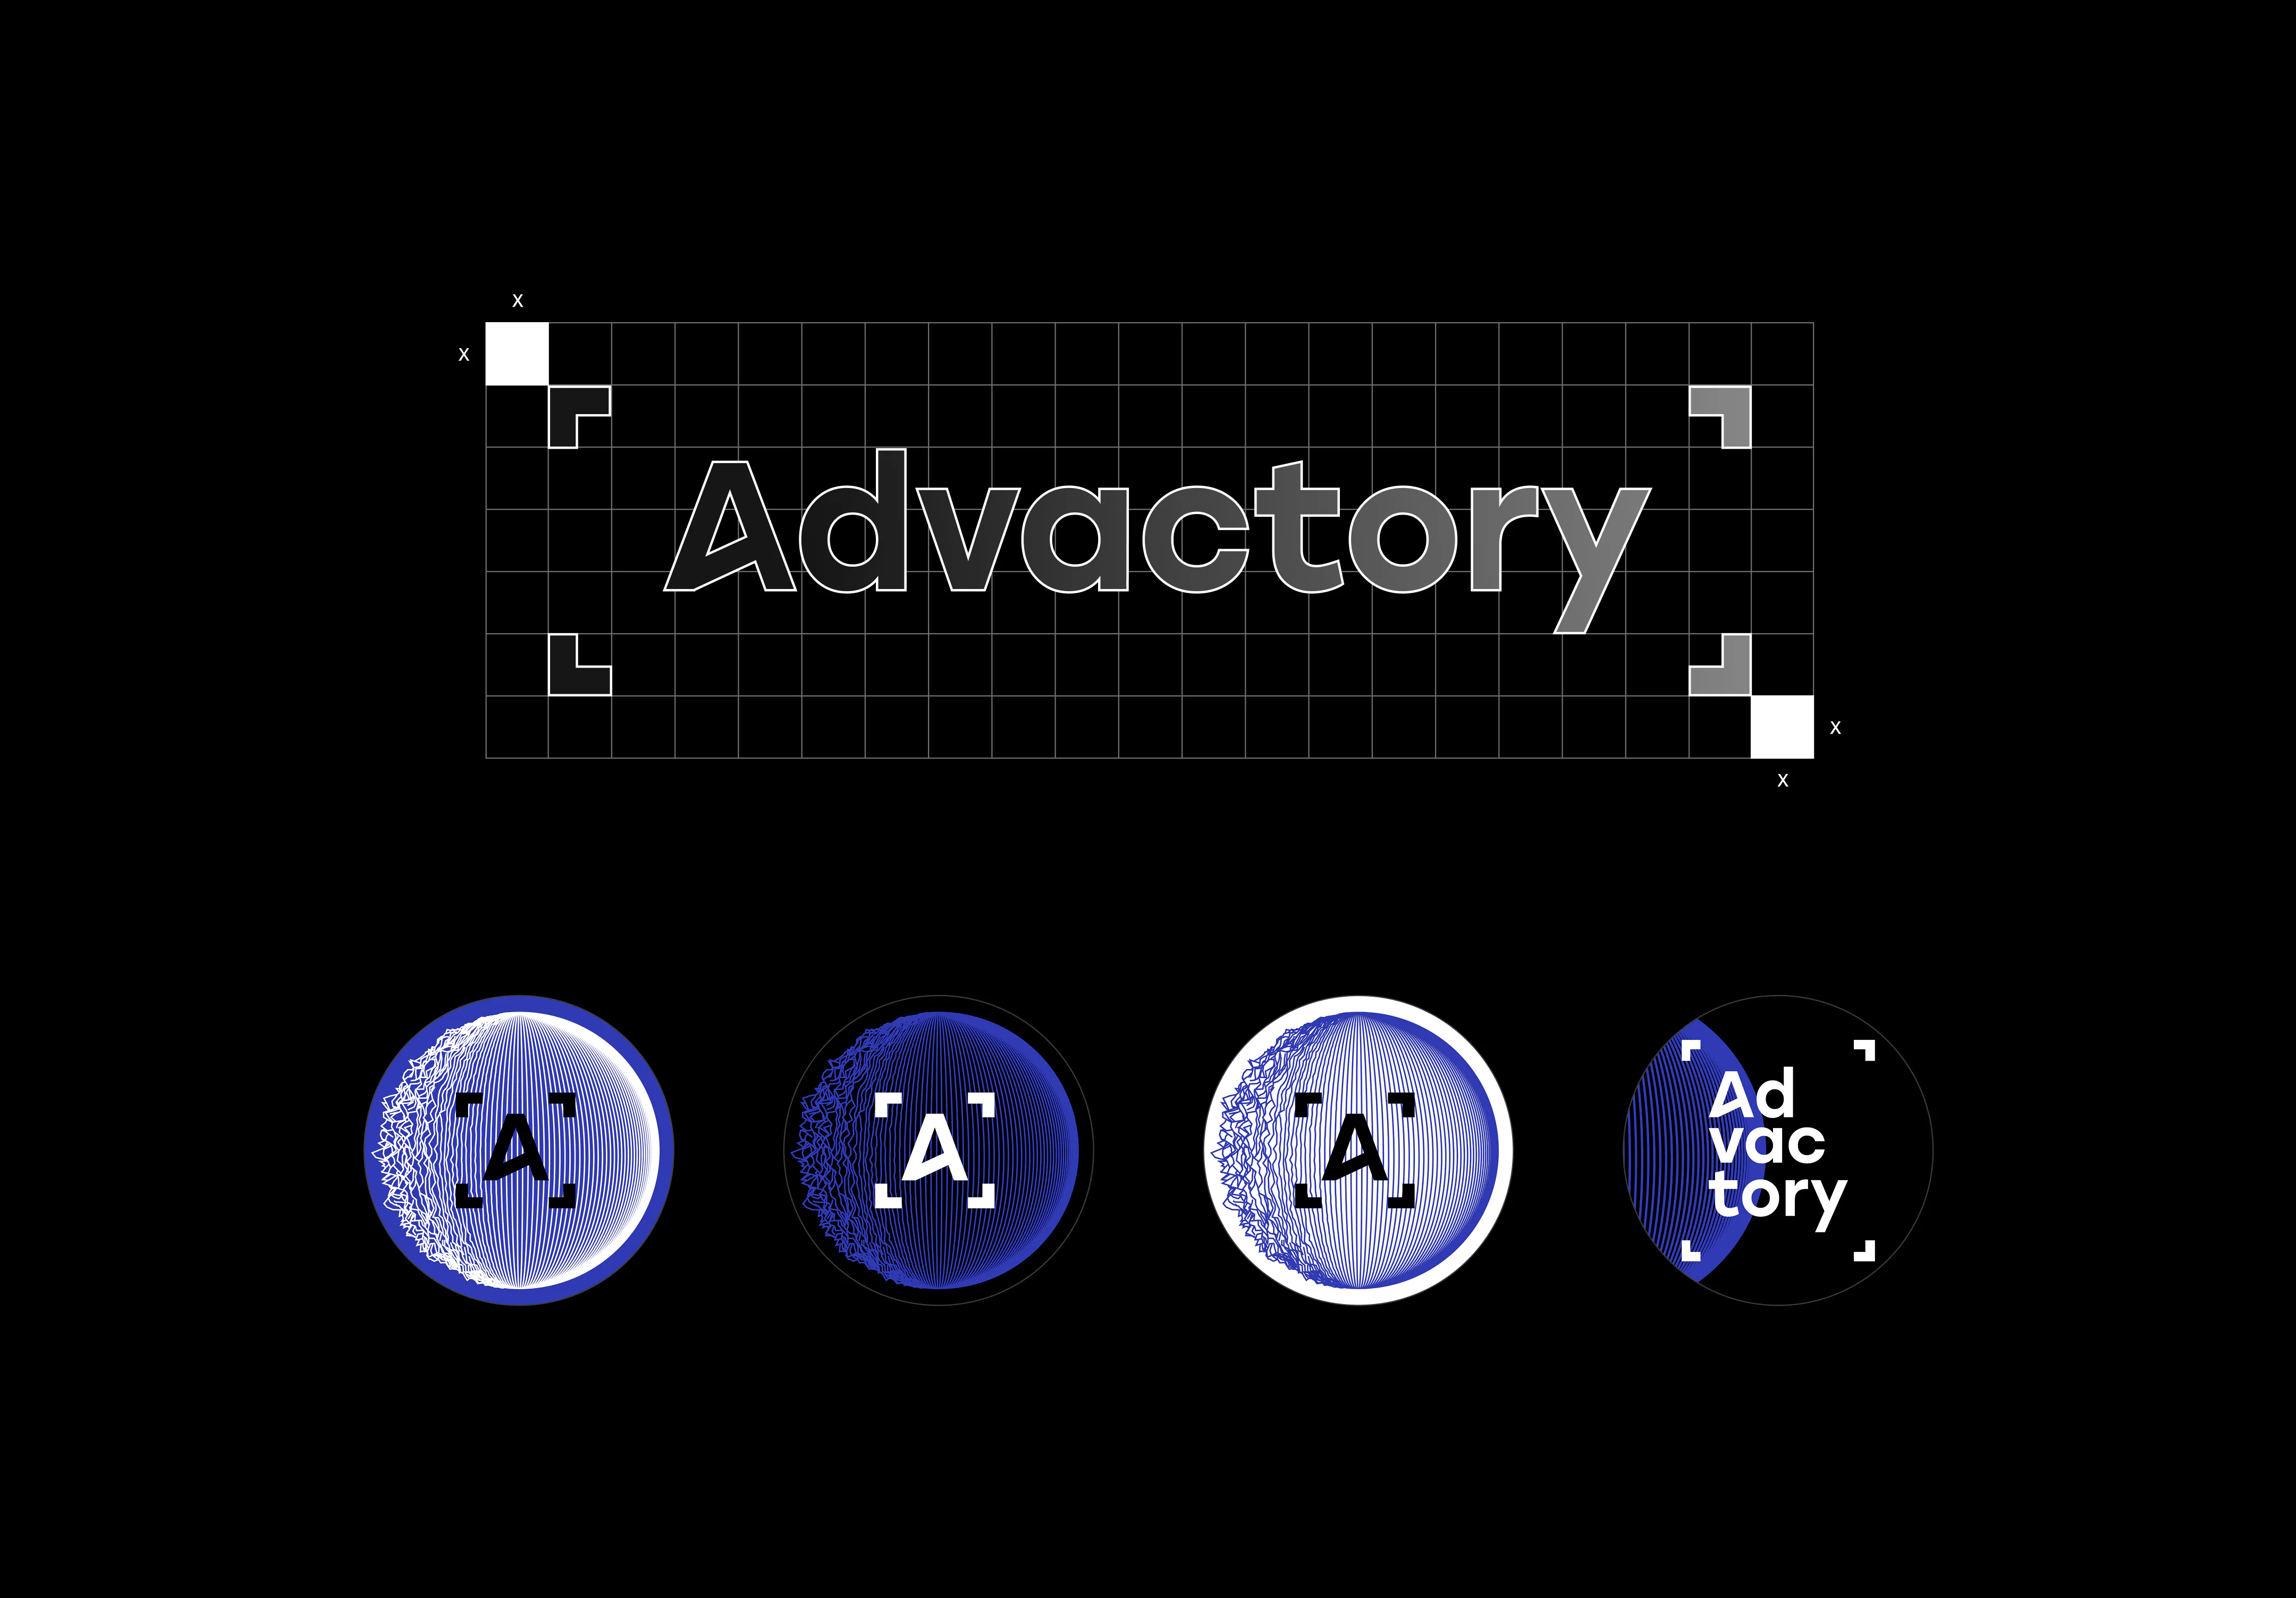
Advactory wordmark on a construction grid with spacing guides and four circular logo variations in blue, black, and white.
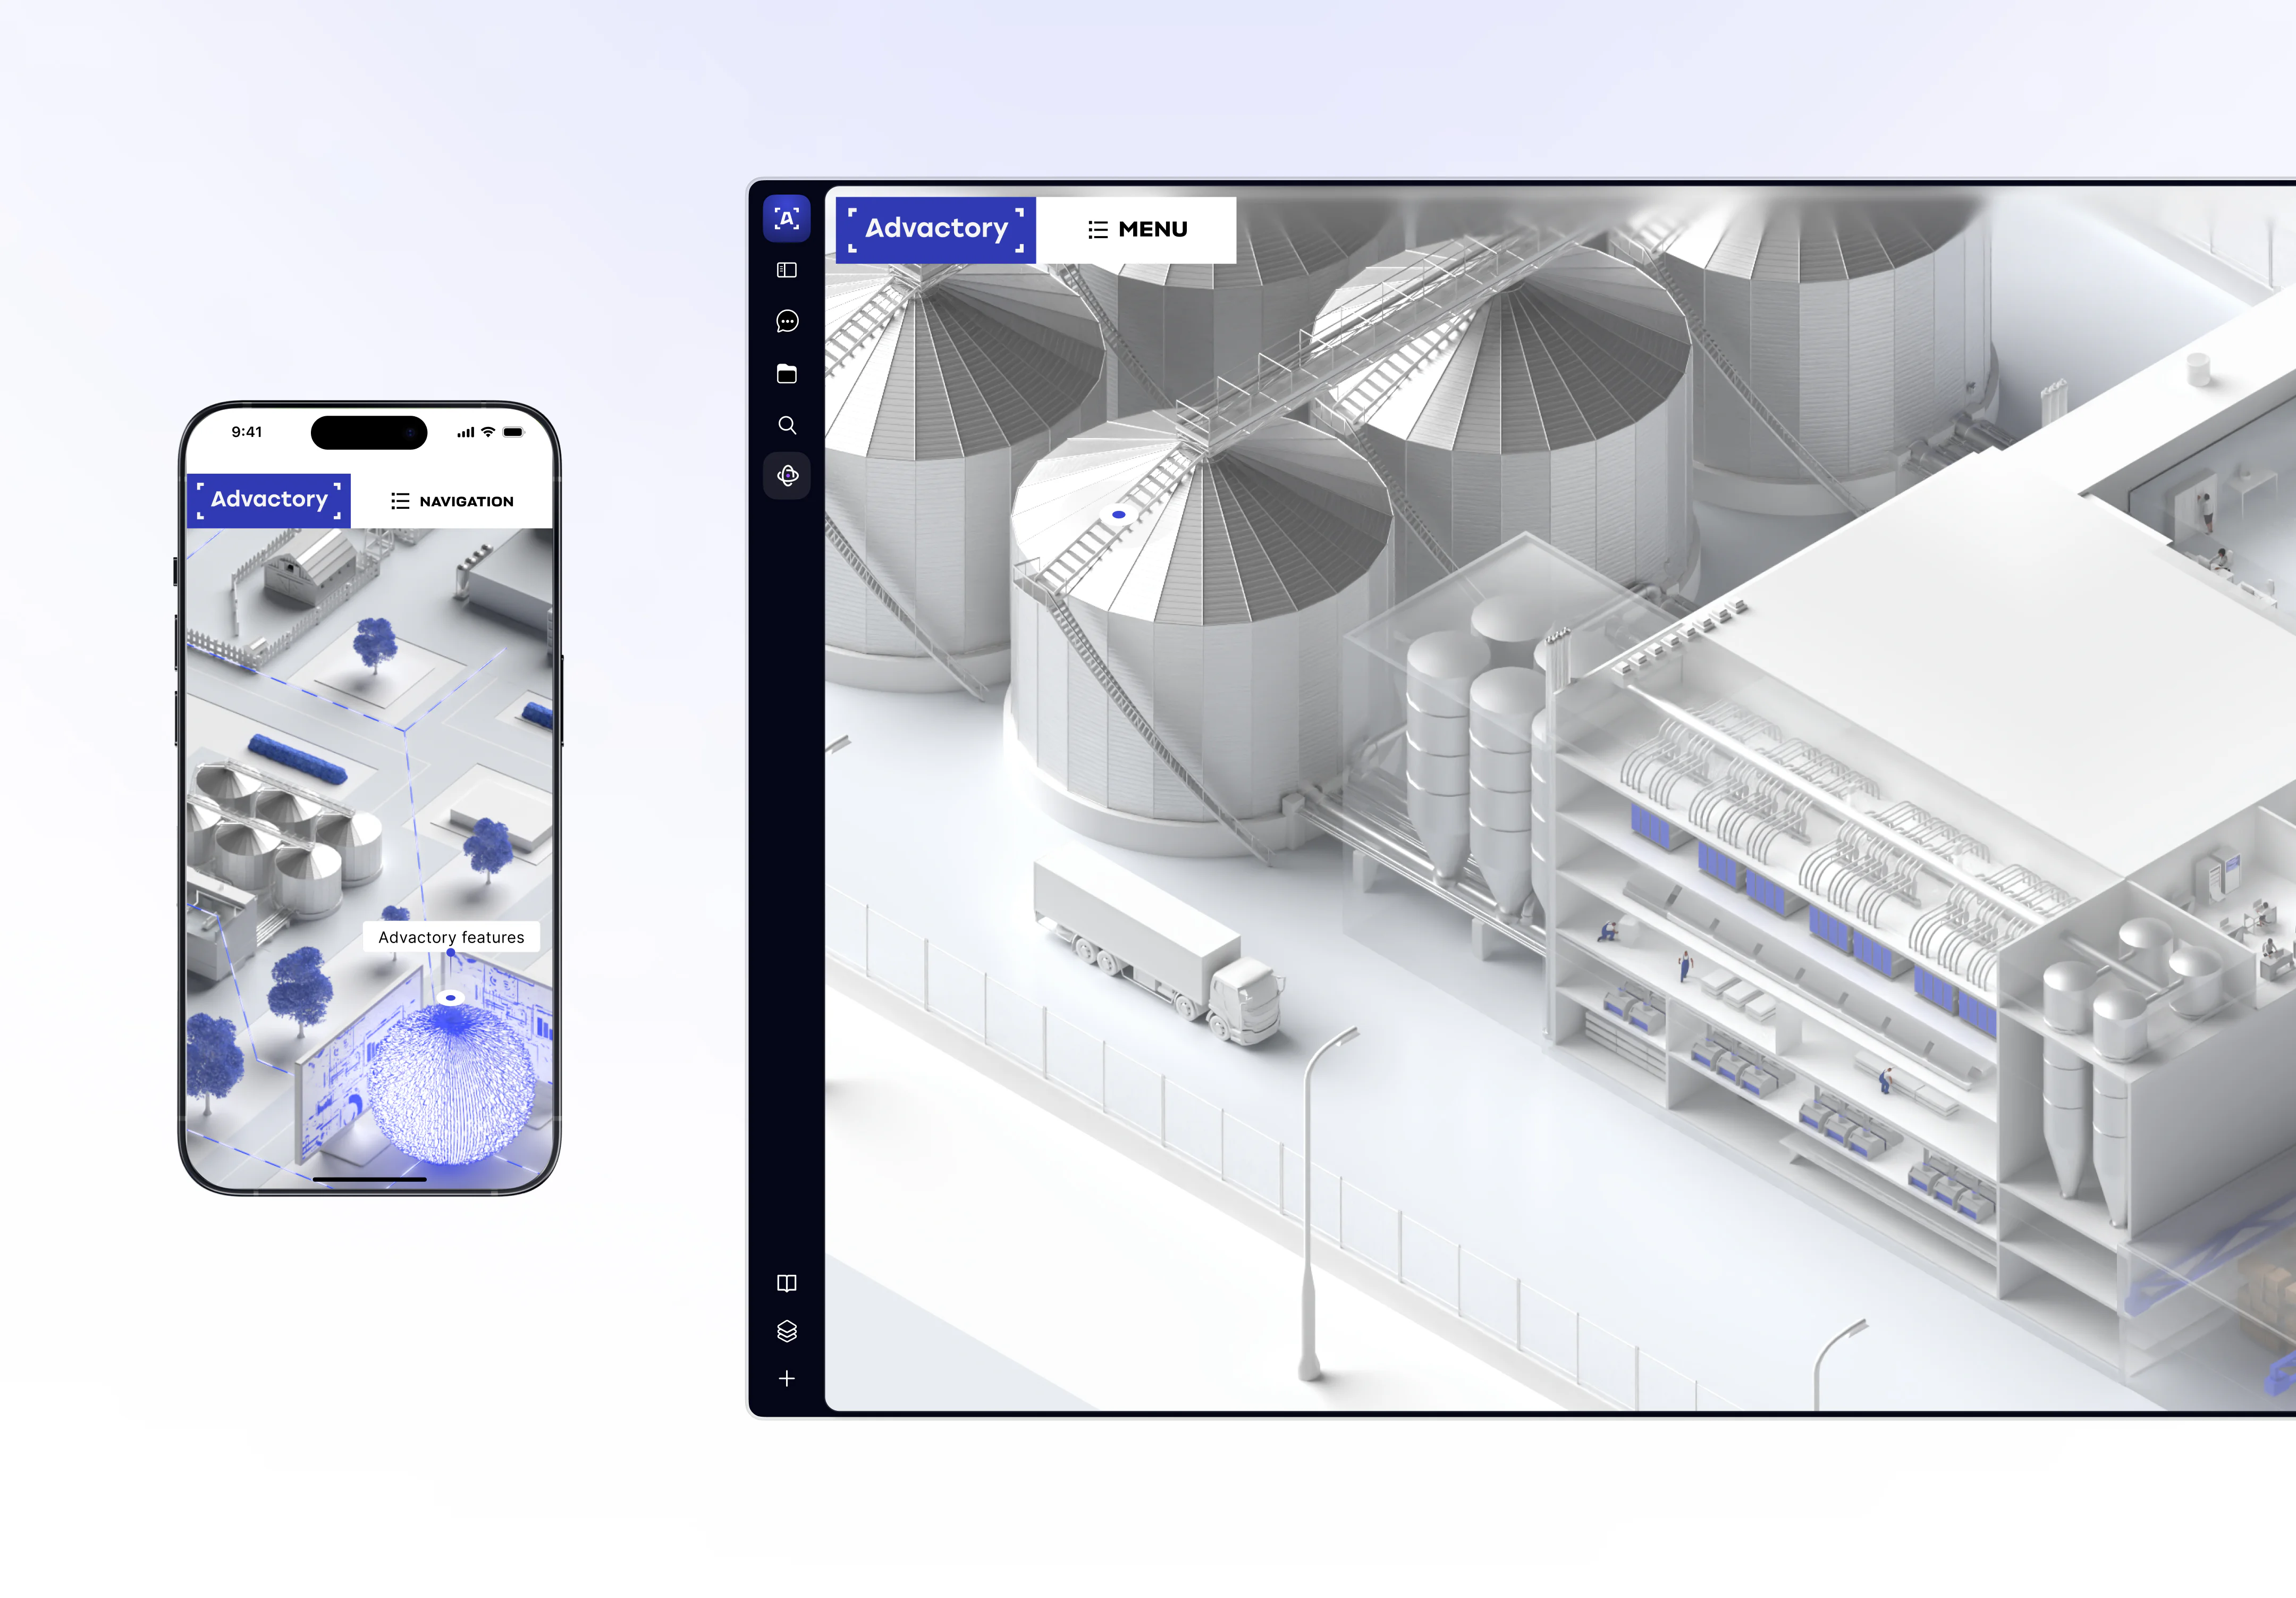
Advactory website on desktop and mobile, displaying 3D views of a flour mill, storage silos, and connected industrial facilities.
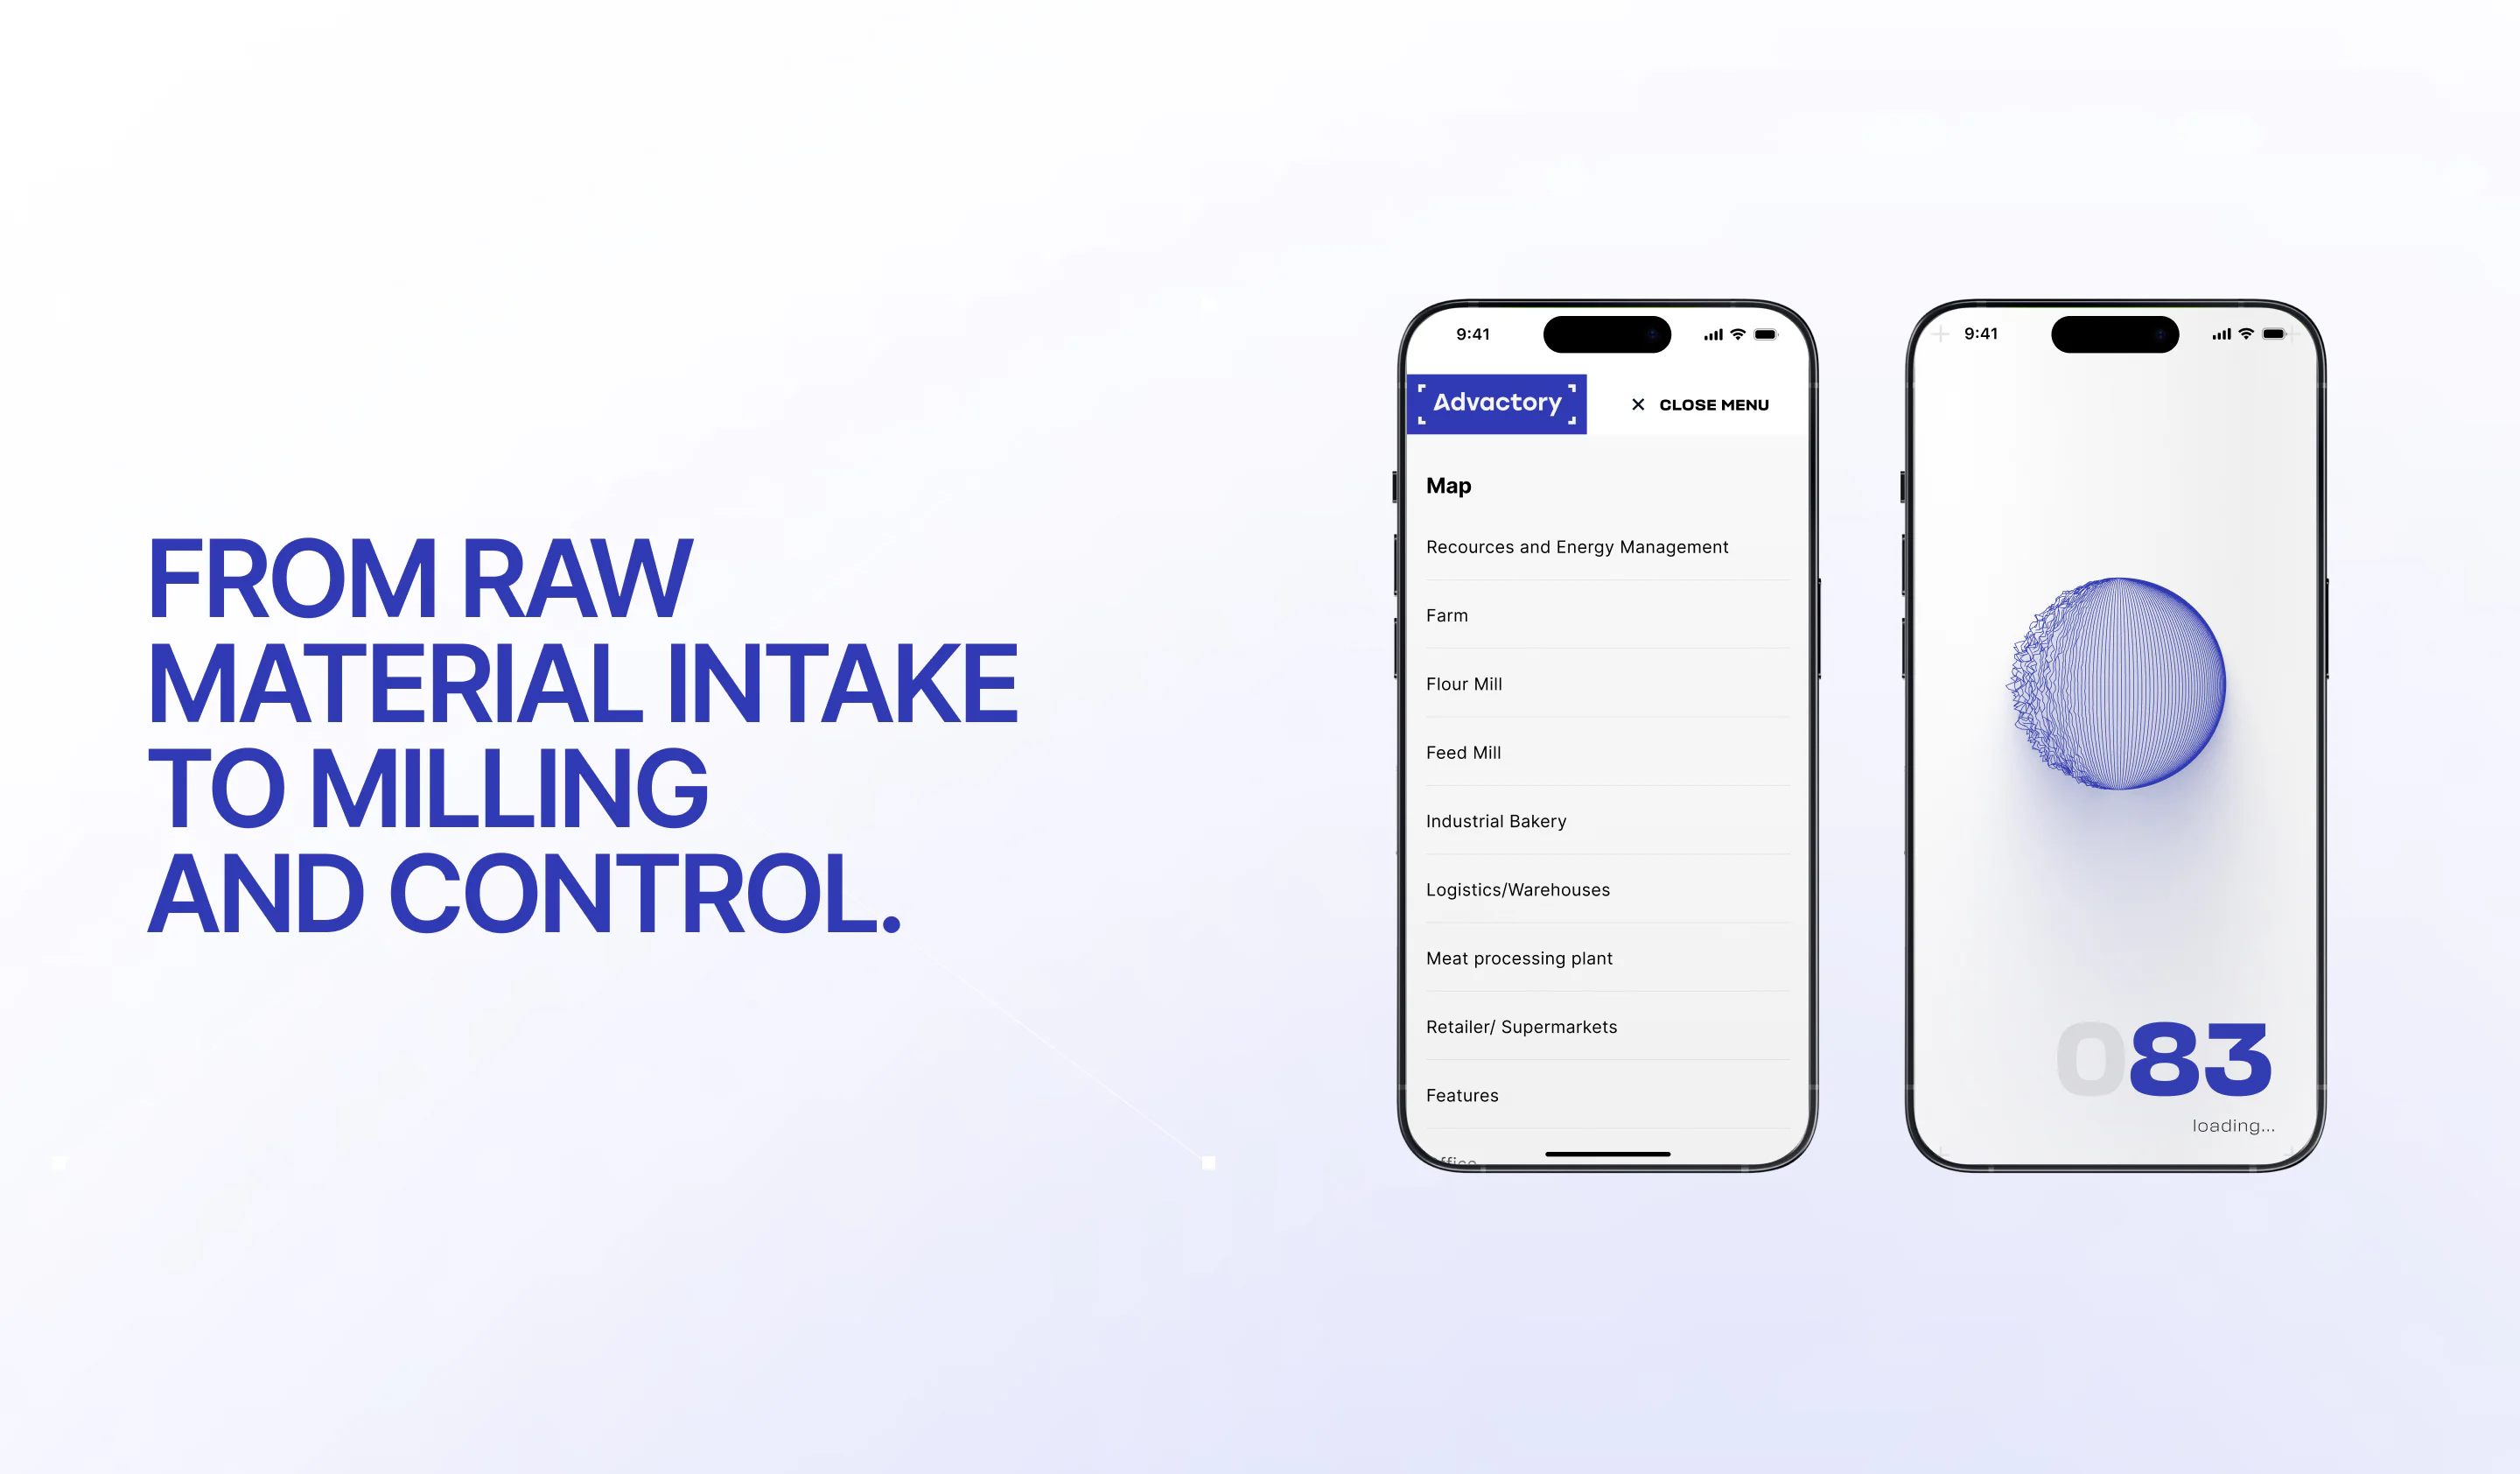
mobile website showing an industry navigation menu and a loading screen with a blue wireframe sphere.

NOTHING LIKE A USUAL SITE

Advactory is a standalone product within the Wingmen ecosystem (a parent company we had previously designed a website for), and its site was never meant to chase traffic or optimize conversions. Instead, it functions as a visual sales and explanation tool. The goal was to help the client clearly show how the software works, what data it measures, and how all the pieces connect, often live. Nothing beats a clickable map for a goal like this.
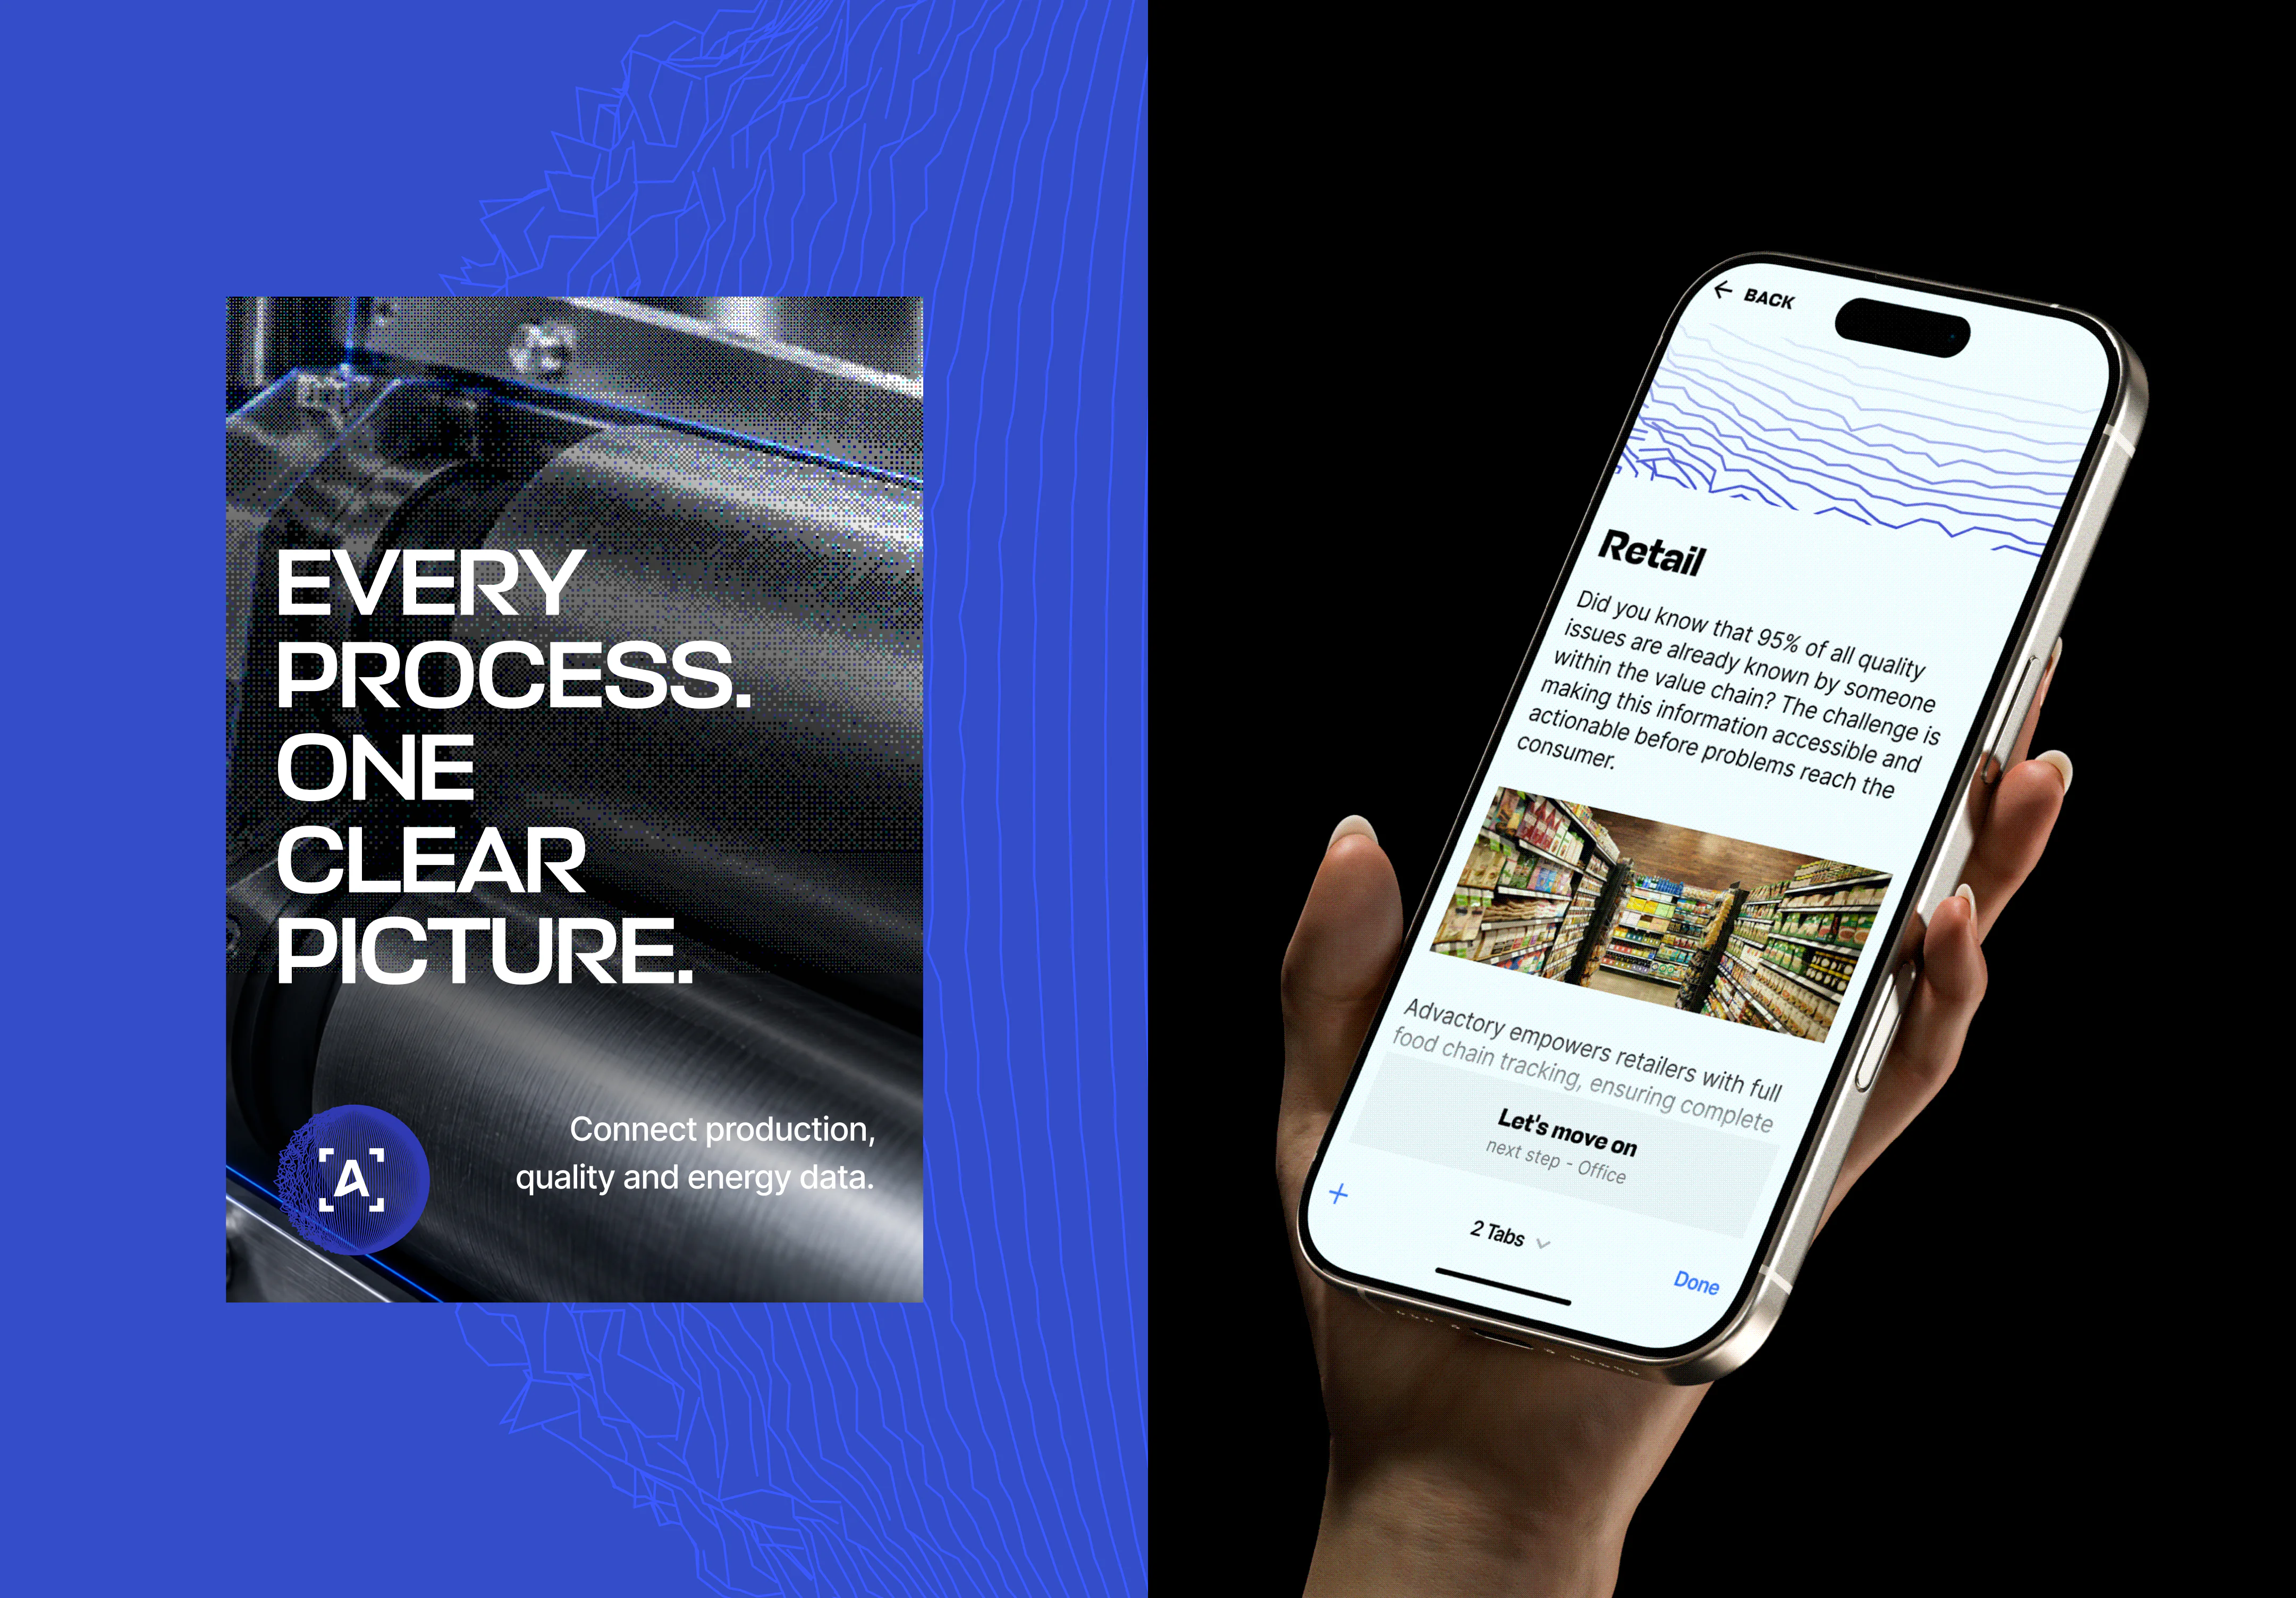
Advactory brand graphic reading “Every process. One clear picture.” beside a smartphone displaying the website’s retail page.
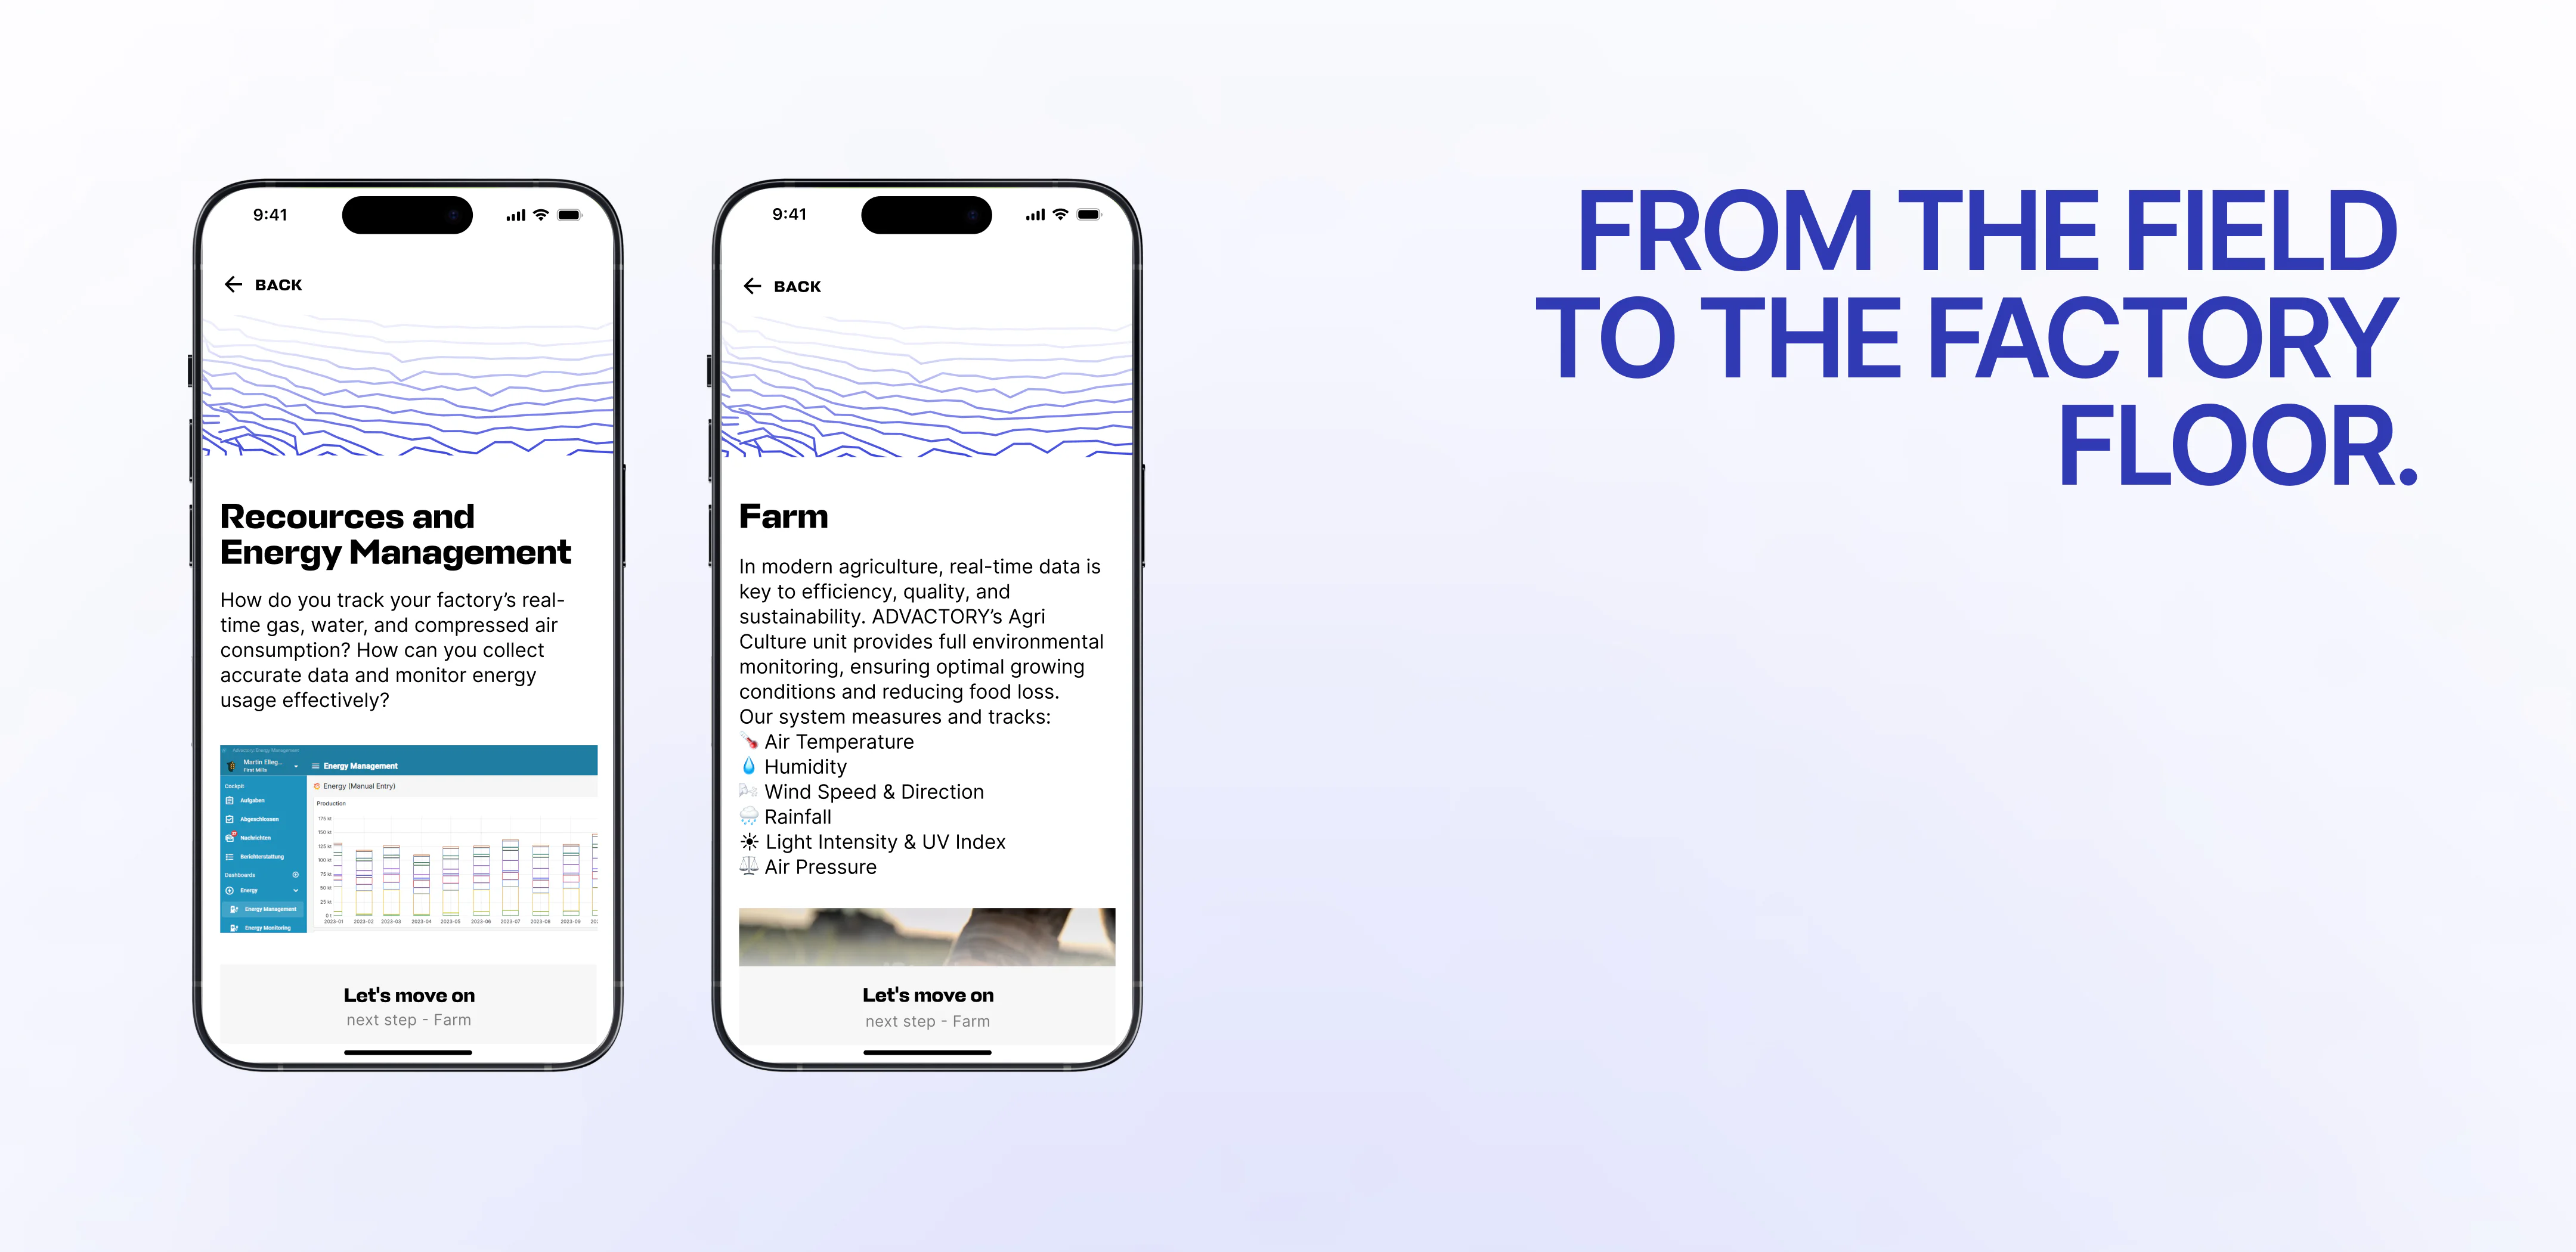
mobile website showing energy management and farm monitoring pages beside the headline “From the field to the factory floor.”
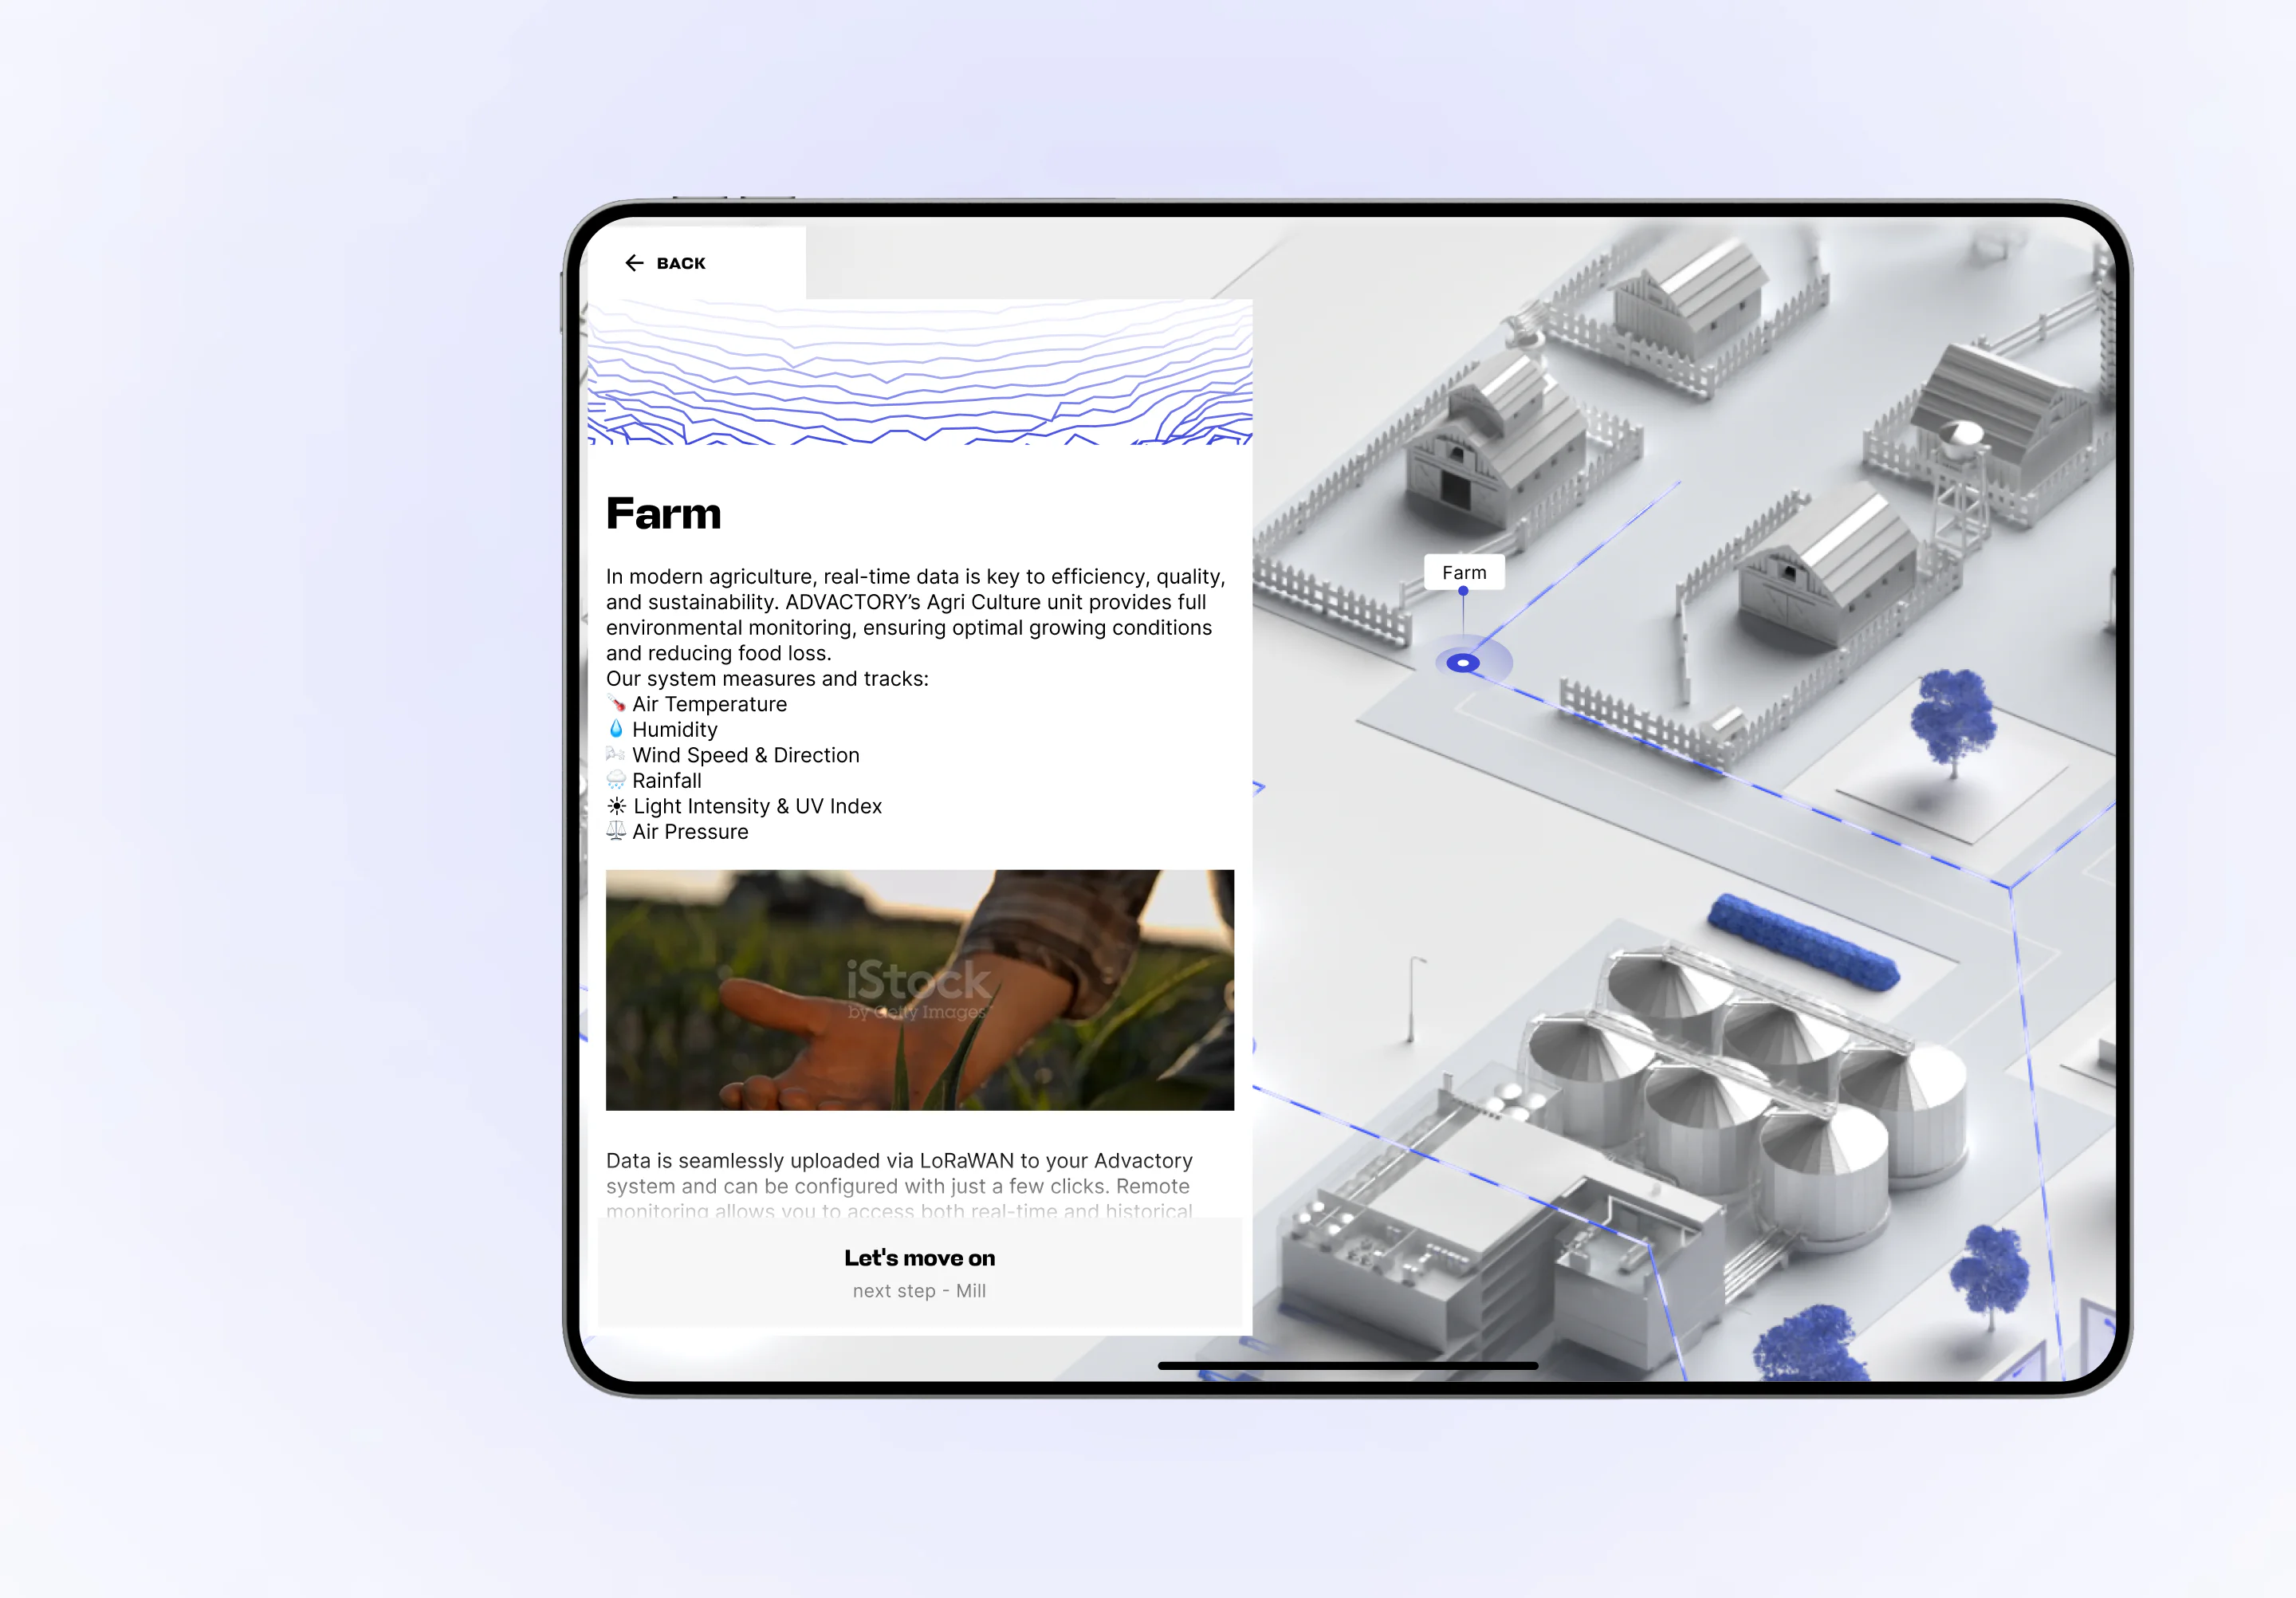
Advactory farm page on a tablet, combining environmental monitoring information with a 3D map of farm buildings and storage silos.

RESULTS

While this wasn’t a metrics-driven website in the classic sense, it quickly became a practical tool for presentations and client conversations; something the team could open, share on screen, and walk people through.
This project gave us hands-on experience with a very unconventional format, which directly led to another project built on a similar idea. We now know how to design and execute complex, map-based, explanatory products like this. For most teams, this would be a steep learning curve. For us, it’s now a repeatable capability.
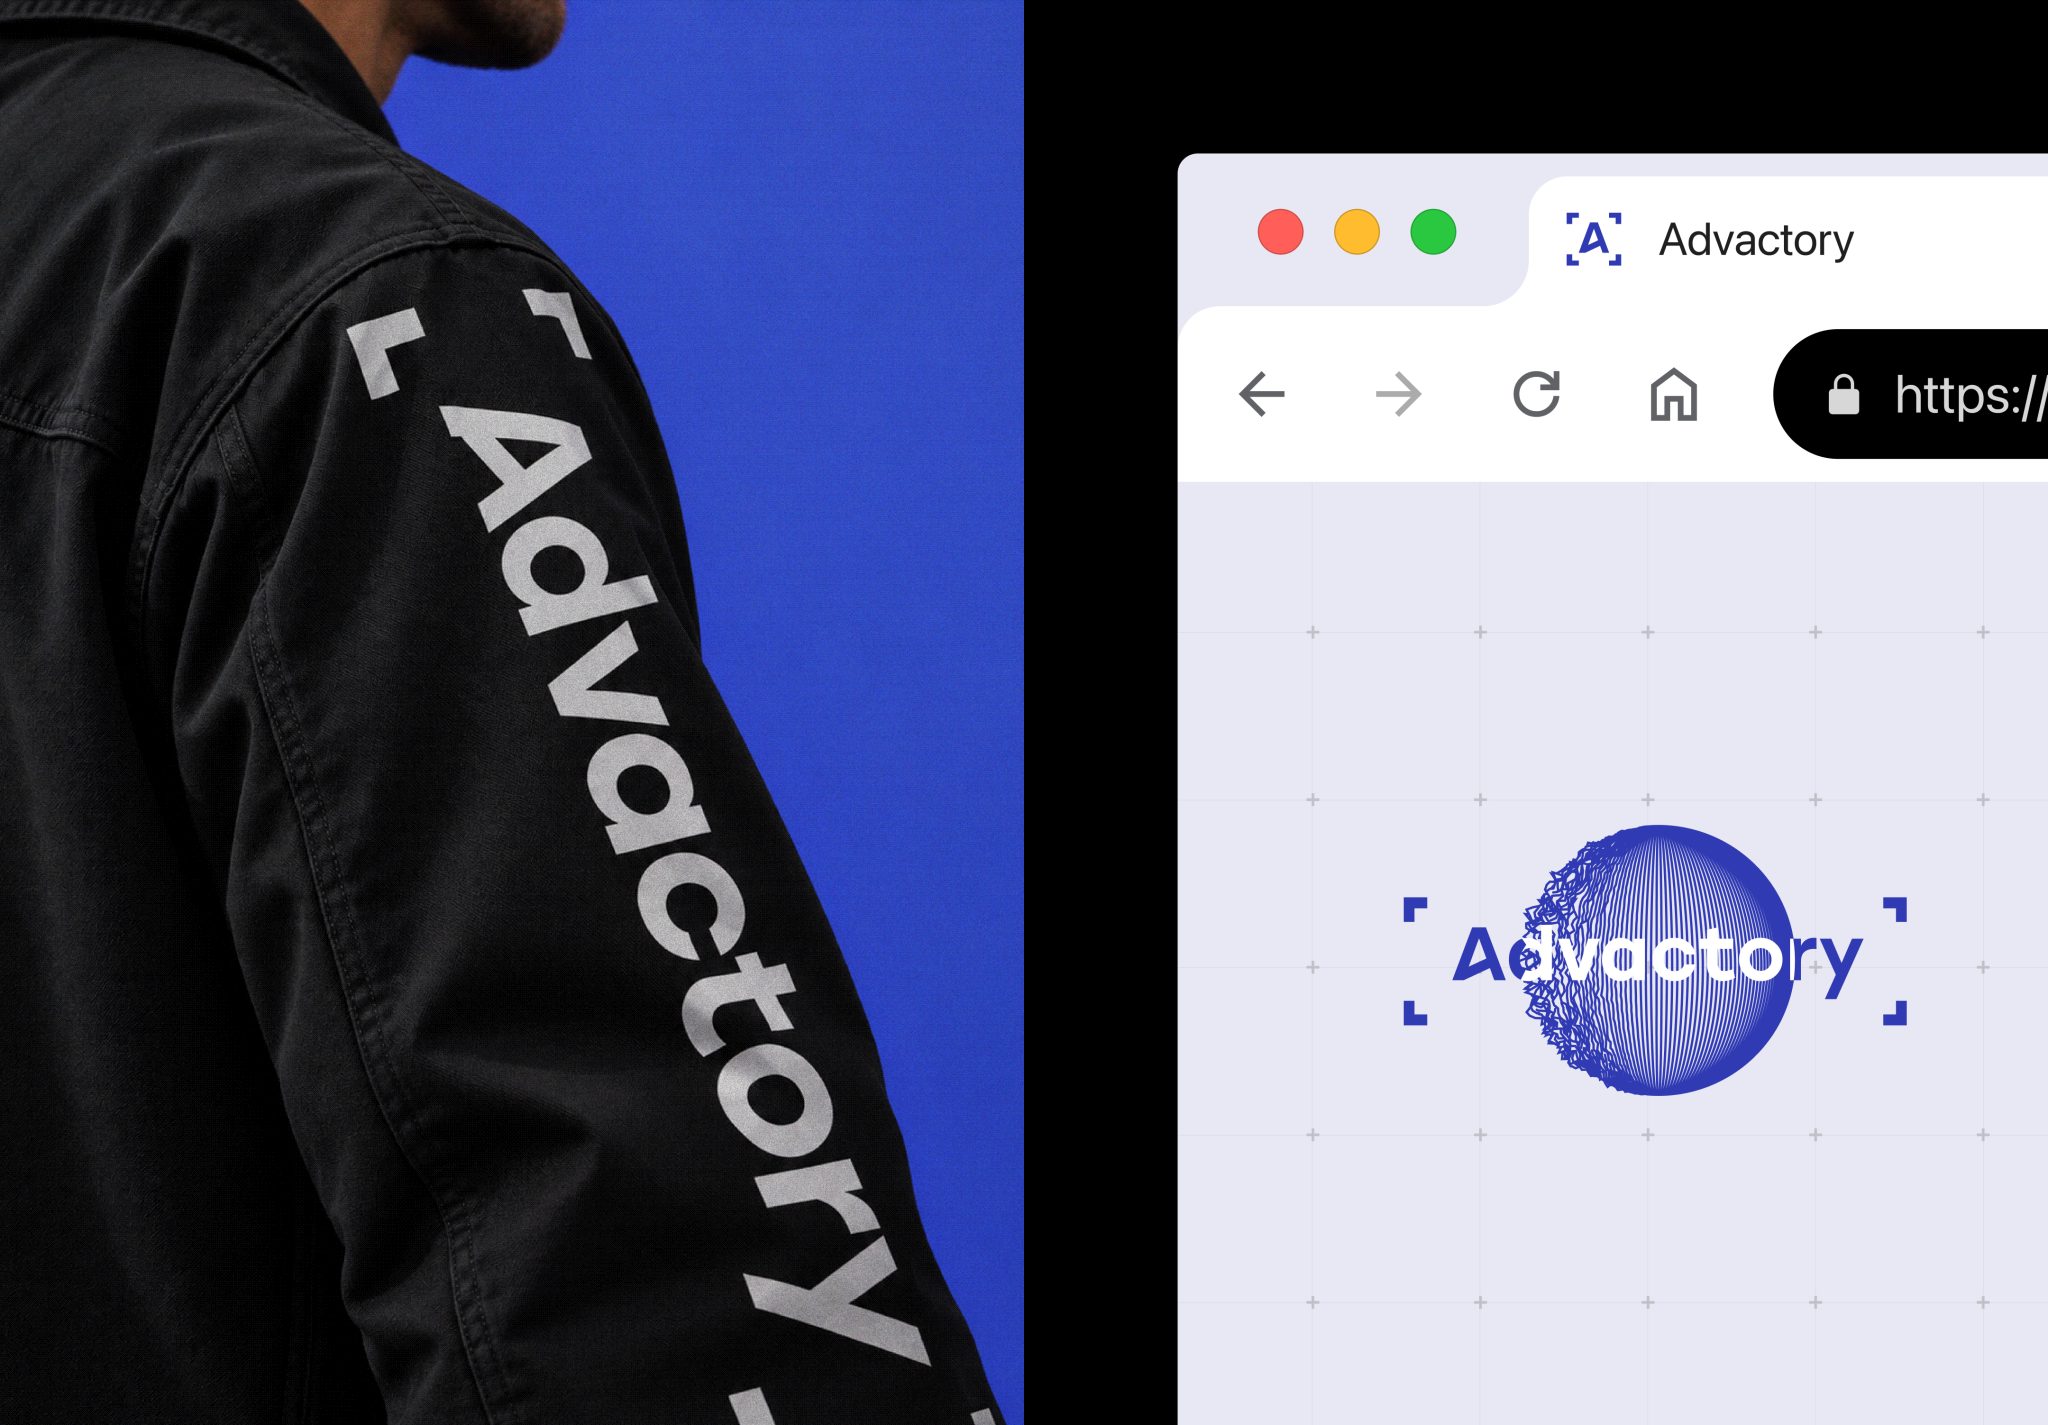
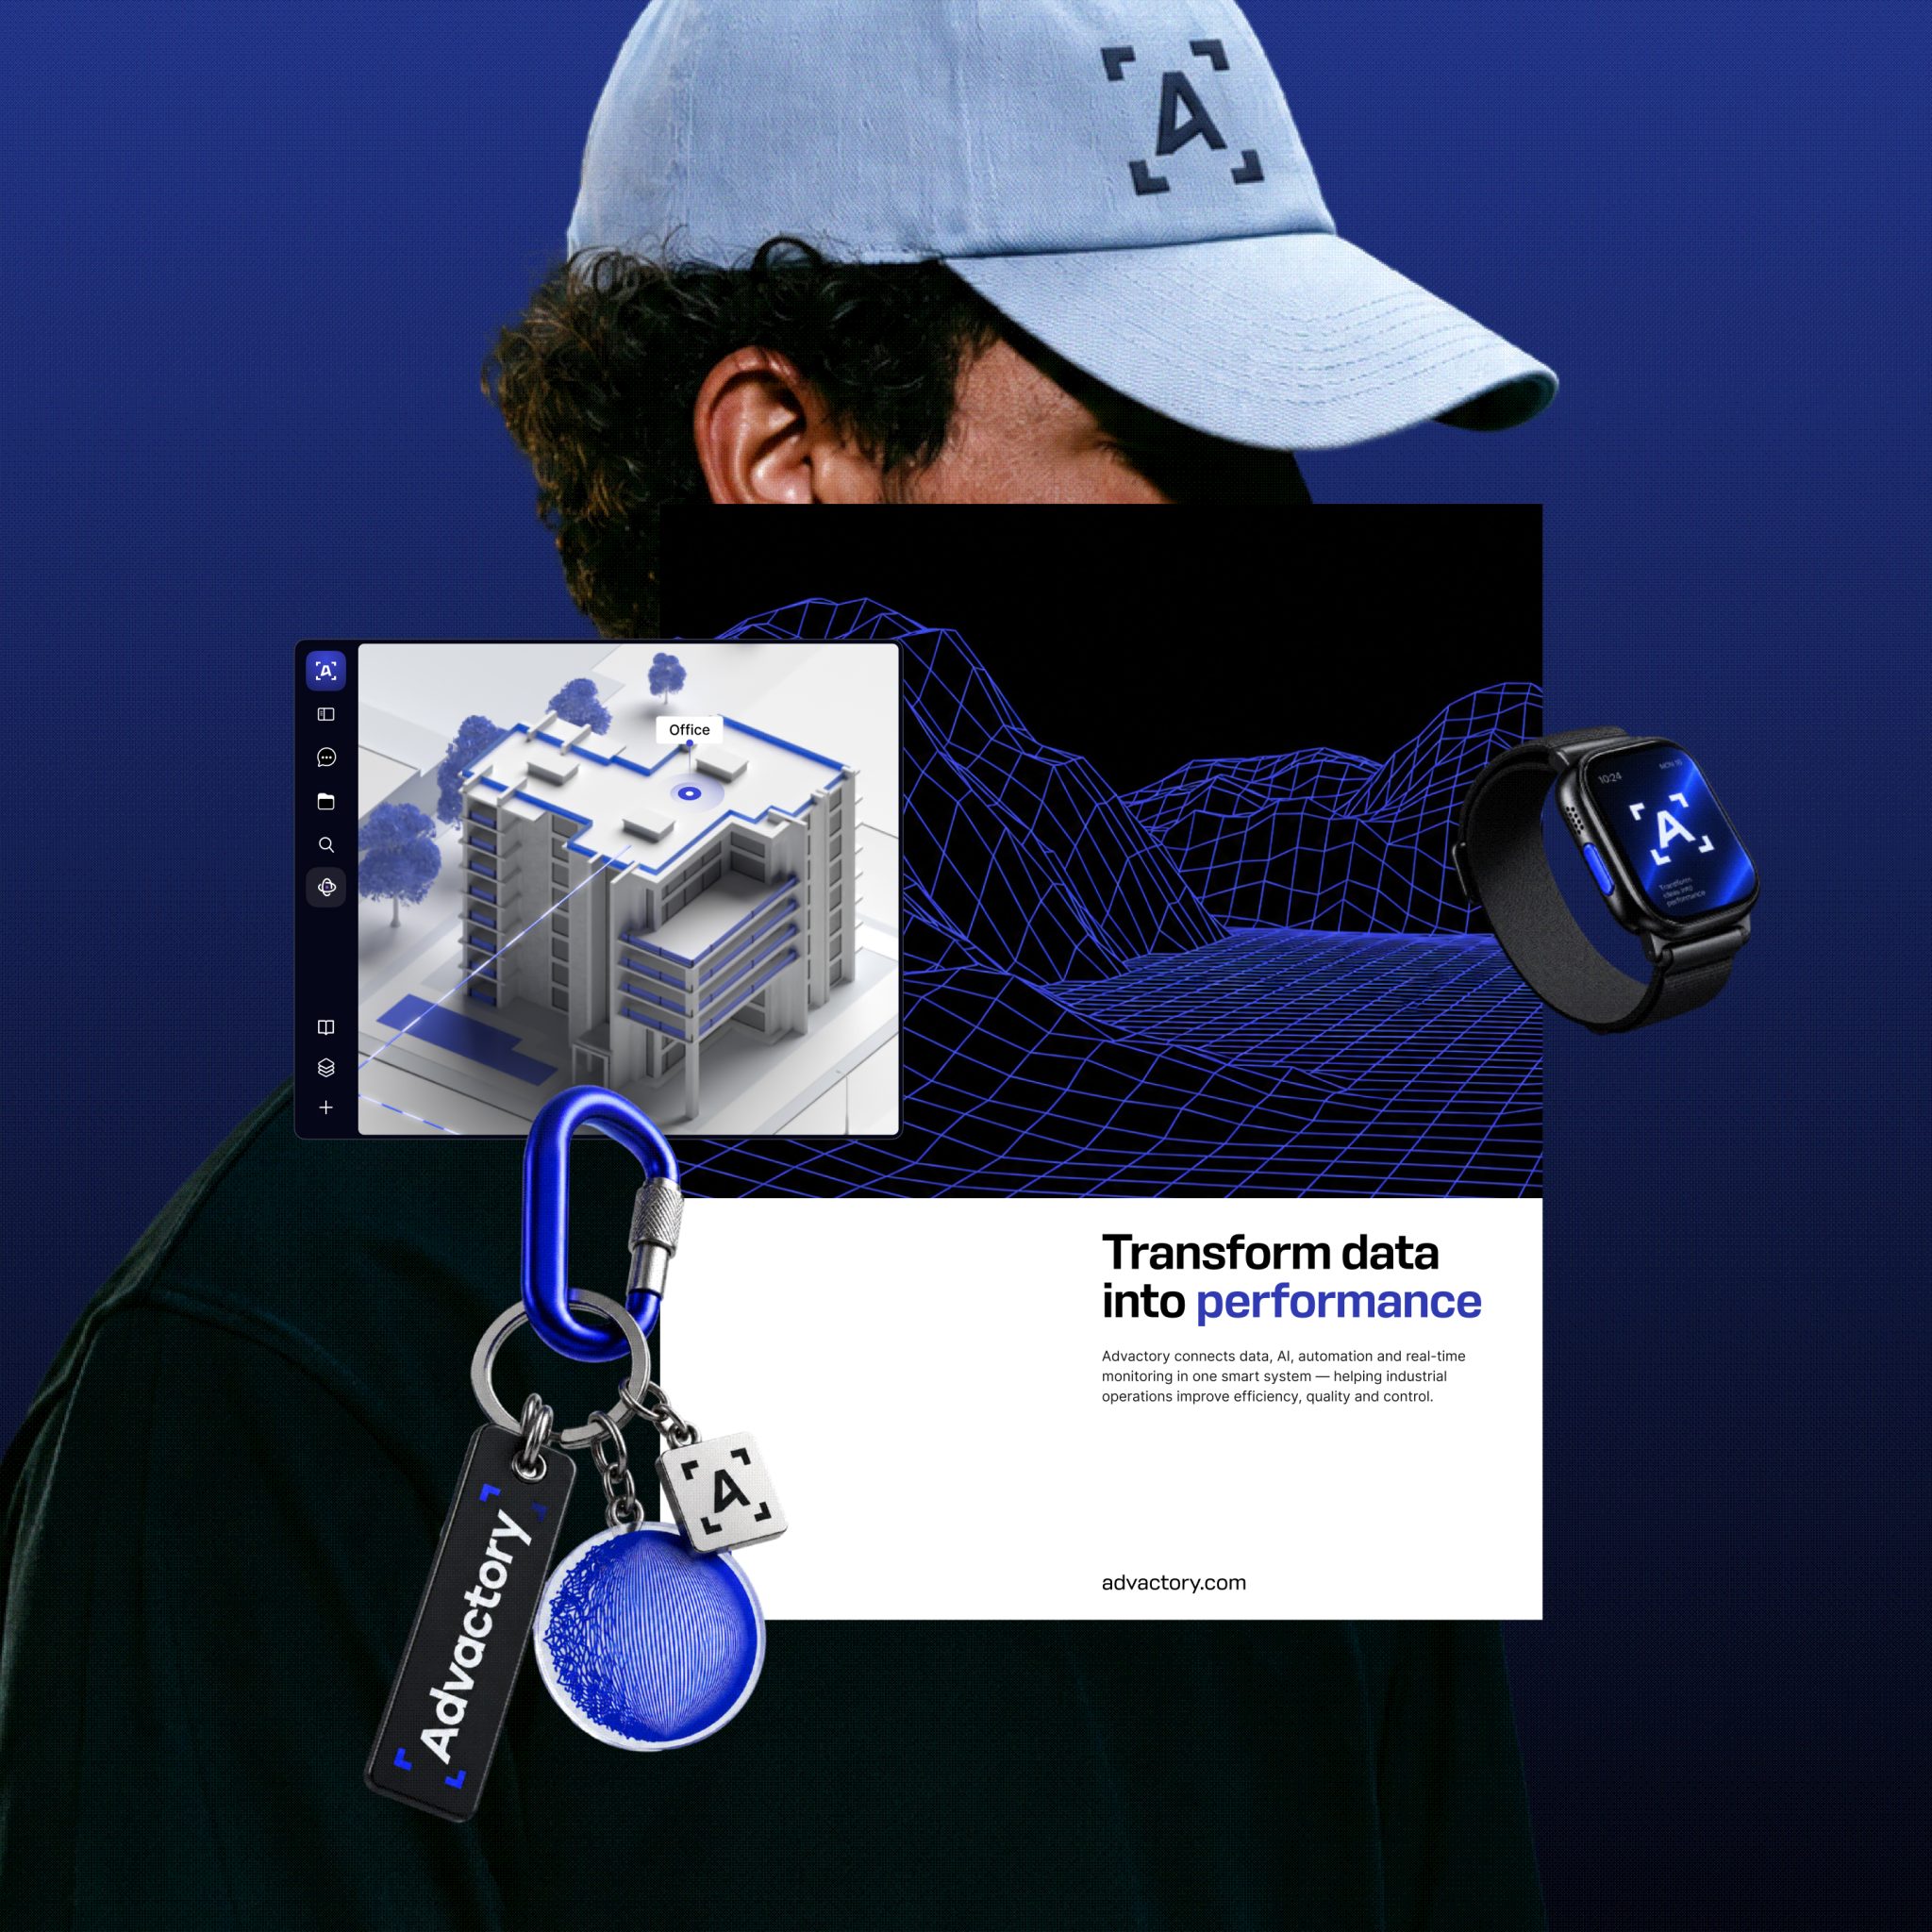
wordmark on a black jacket sleeve beside a browser mockup displaying the logo and blue wireframe sphere
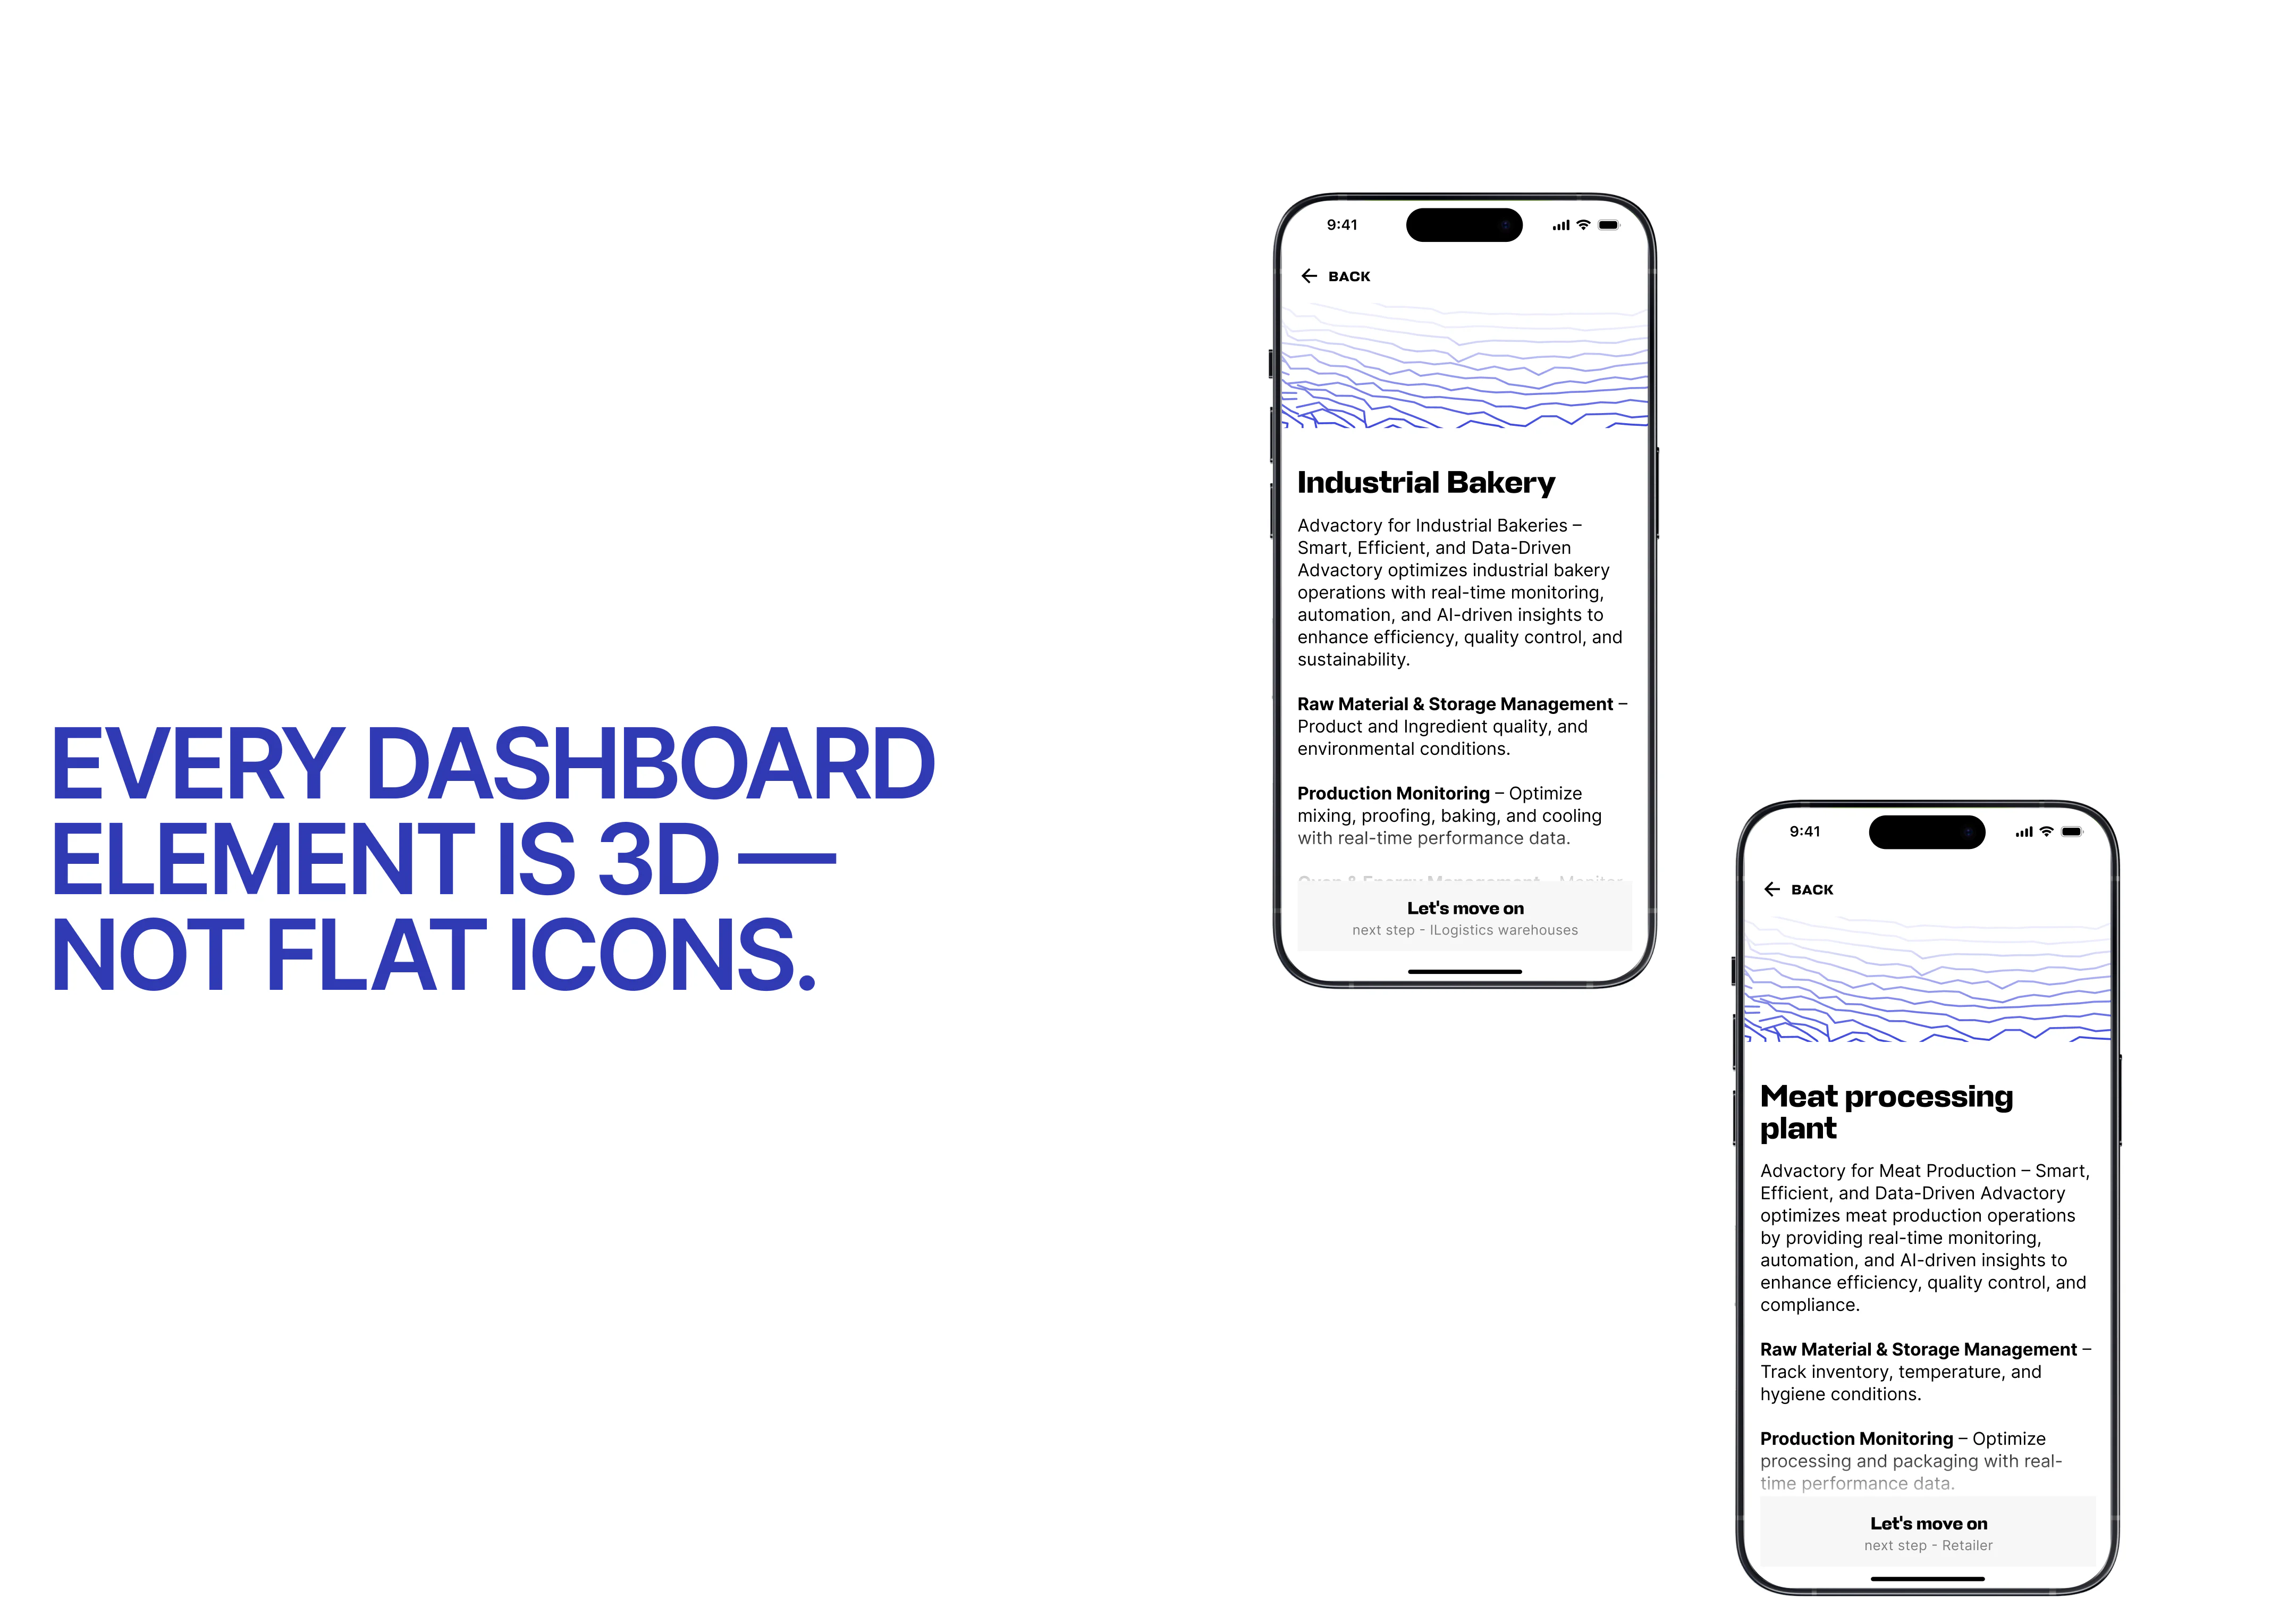
mobile website displaying industrial bakery and meat processing pages alongside a statement about its 3D dashboard design.
Advactory mobile website displaying industrial bakery and meat processing pages alongside a statement about its 3D dashboard design.
brand collage featuring a cap, smartwatch, keychains, 3D website interface, and a poster reading “Transform data into performance.”

Frequently Asked Questions

  • How do you design a website for a complex SaaS product?

    A website for a complex SaaS product should explain what the platform does, how it works, and how its parts connect before listing individual features. The design process starts with understanding the product’s workflows, data sources, and audience. For Advactory, VALMAX created an interactive map that shows how the software relates to different stages of food production, from raw materials to shipping.

  • When is an interactive map-based website a good fit for manufacturing software?

    A map-based website can work well when software supports a process with connected stages, equipment, or data sources that are difficult to explain through standard page navigation. Advactory’s website places the platform at the center of a visual production system. Visitors can select the Mill and explore a second map showing the flow from raw materials entering silos through processing and logistics.

  • What should a company prepare before starting a custom SaaS website design project?

    Prepare a clear product overview, the main workflows the website needs to explain, and the questions customers ask during sales conversations. It also helps to decide who will use the site and how the team plans to present it. Advactory’s project included research, mood boards, wireframes, and design work to translate a complex food production system into an interactive map.

  • Can a B2B SaaS website support sales presentations?

    Yes. A B2B SaaS website can be designed as a visual presentation tool when a team needs to explain how its software works in context. Advactory’s website lets the team share the screen, navigate a clickable map, and walk clients through the production process. The site was built for product explanation and sales conversations rather than as a conventional traffic or conversion-focused website.

  • What does a SaaS rebranding and website design project include?

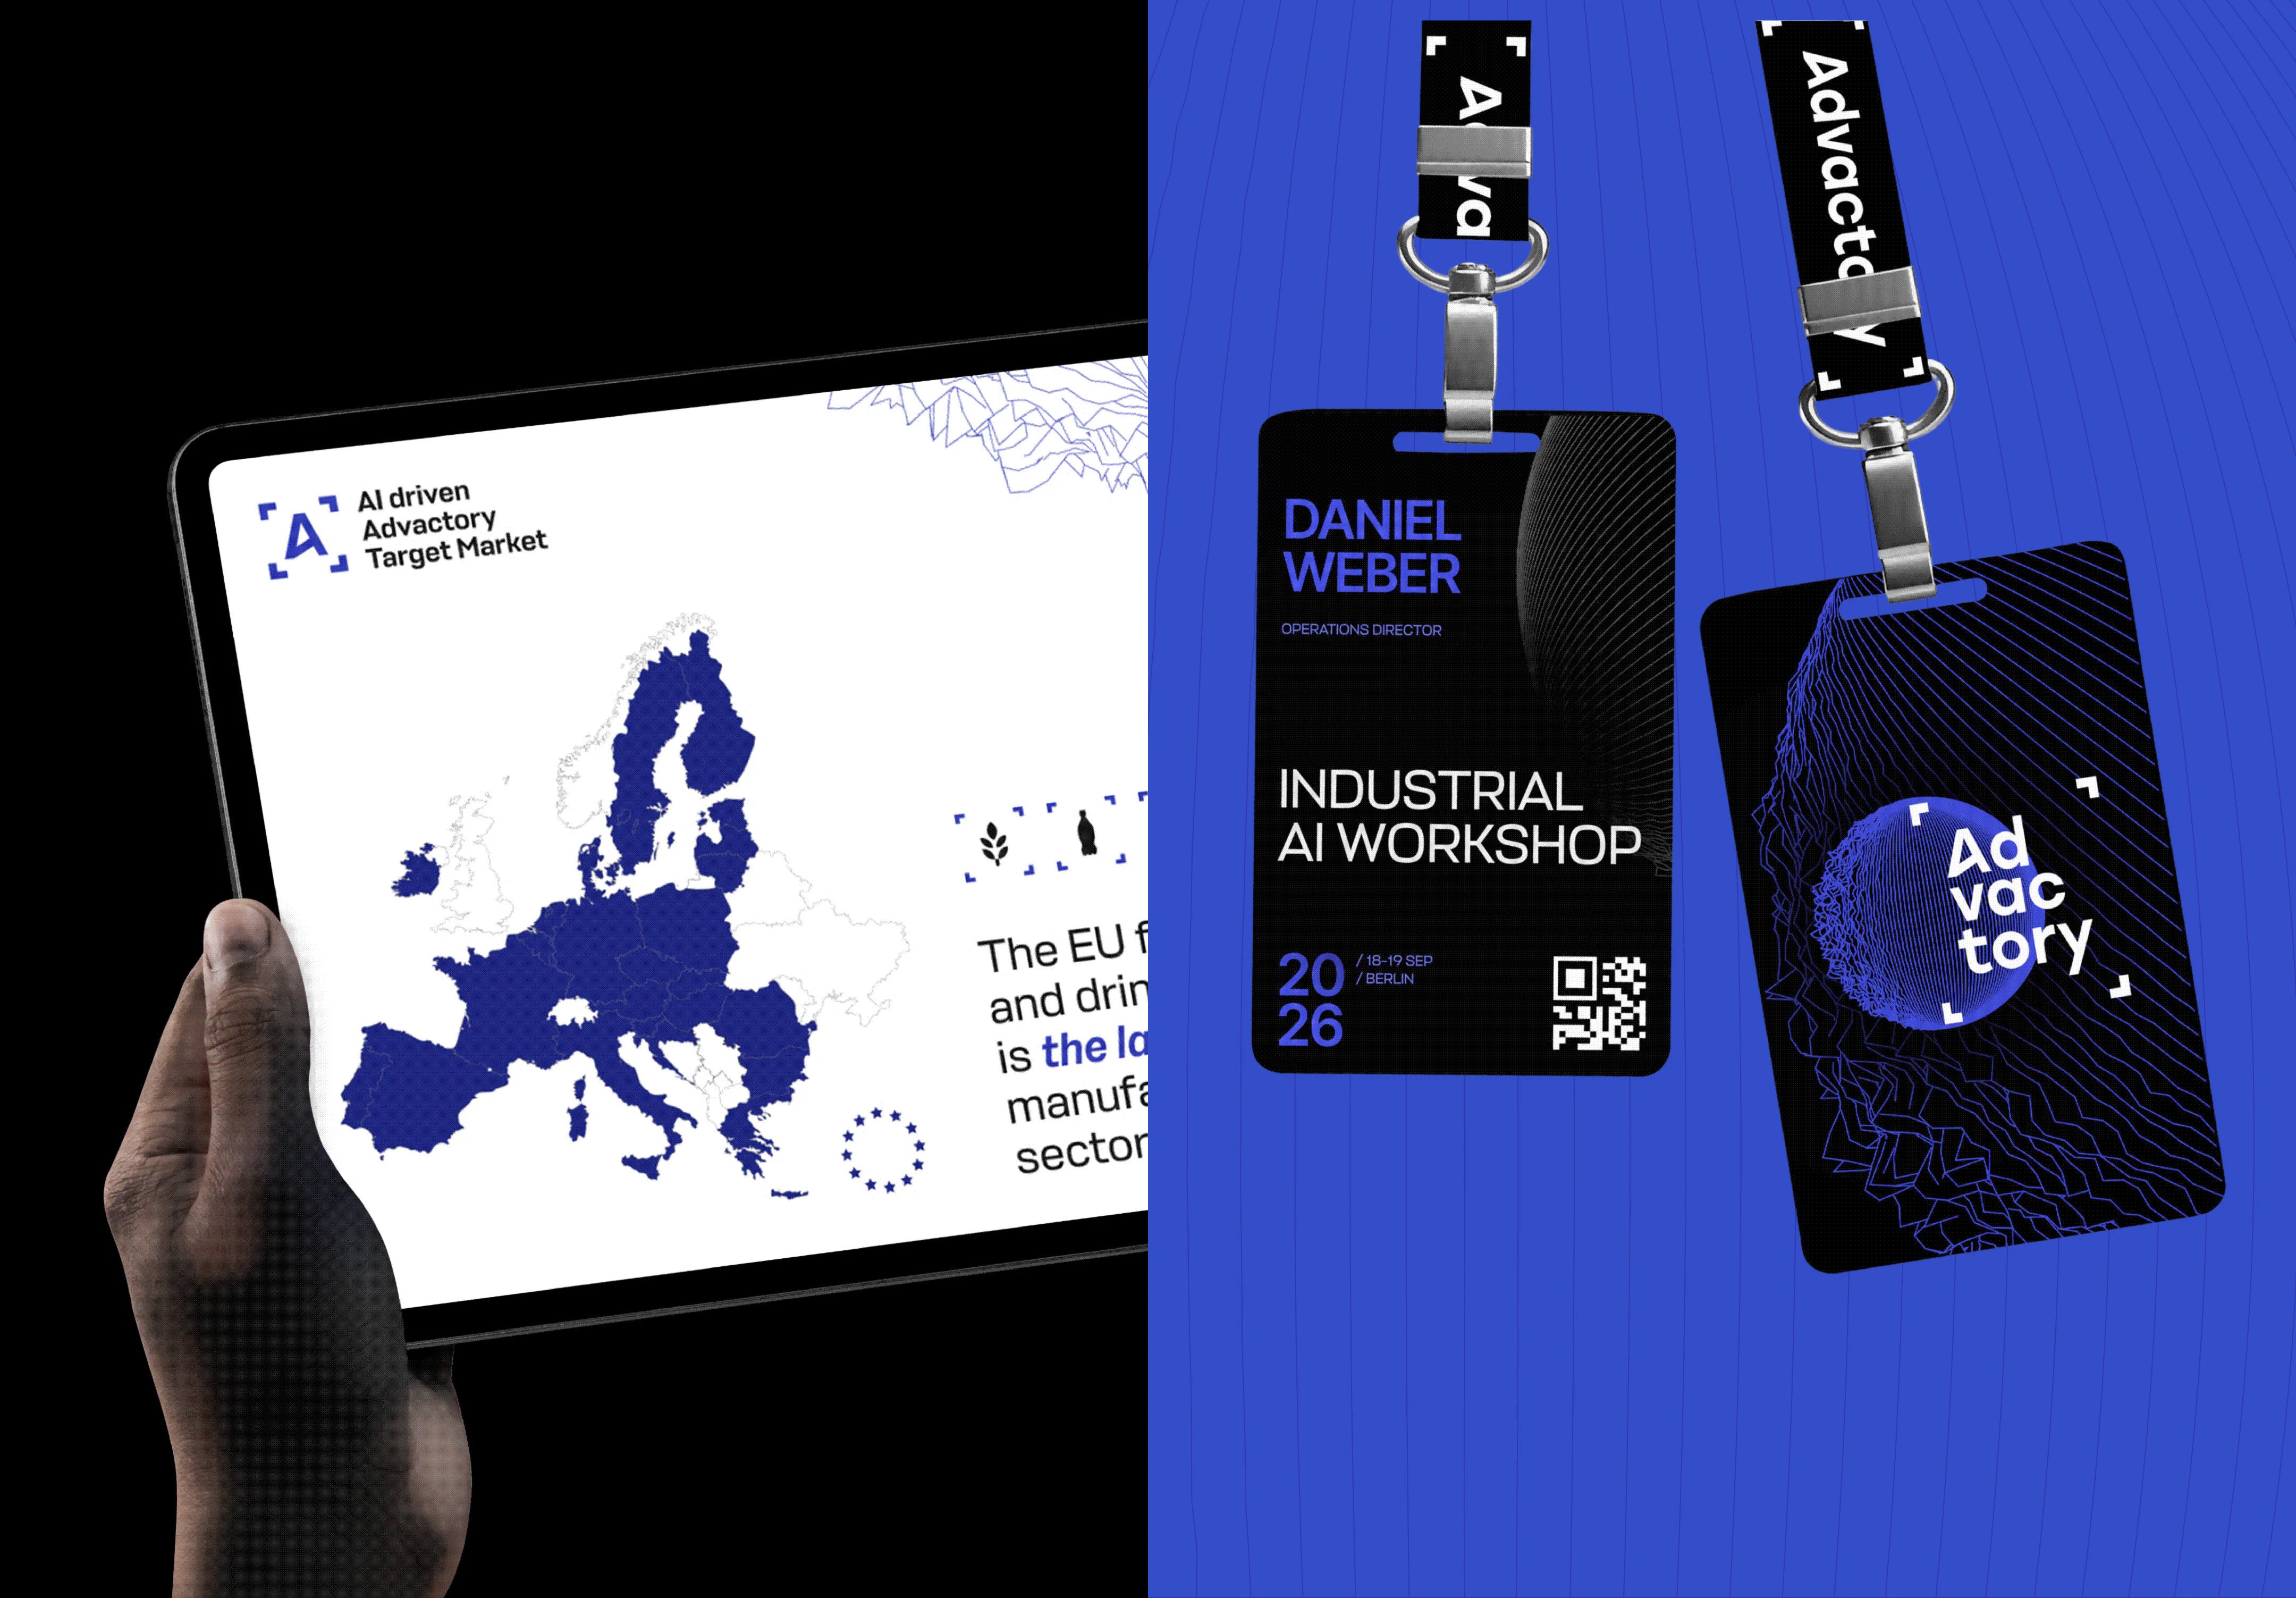
    The scope can include a logo, visual identity, presentation decks, conference materials, and a website that carries the brand into the product story. For Advactory, VALMAX developed the brand foundations first, then designed the map-based website. This sequence gave the team a consistent visual system for introducing the company and explaining its software.

  • How long does it take to rebrand a SaaS company and design a custom website?

    The timeline depends on the scope, number of brand materials, website structure, and complexity of custom interactions. The Advactory project took three months and covered research, mood boards, wireframes, rebranding, and design of the interactive website. A project with a similar map-based format should also account for time to understand the product workflows and review how clearly the visual experience explains them.

READY TO START
THE PROJECT

OR WRITE ON